How variant scoring works#
A genomic variant is a difference identified in an individual’s genome sequence when compared to the reference genome sequence. Many genomic variants likely have no appreciable impact, but it can be challenging to identify those that do have a particular molecular effect. AlphaGenome predictions can be used to score variants and help bridge this gap.
To do so, the variant is treated as a pair of sequences: reference (REF) and
alternate (ALT). The variant effect is estimated by comparing AlphaGenome
predictions for these two sequences across different modalities returned by the
model.
Detailed steps#
Variant scoring is implemented as follows:
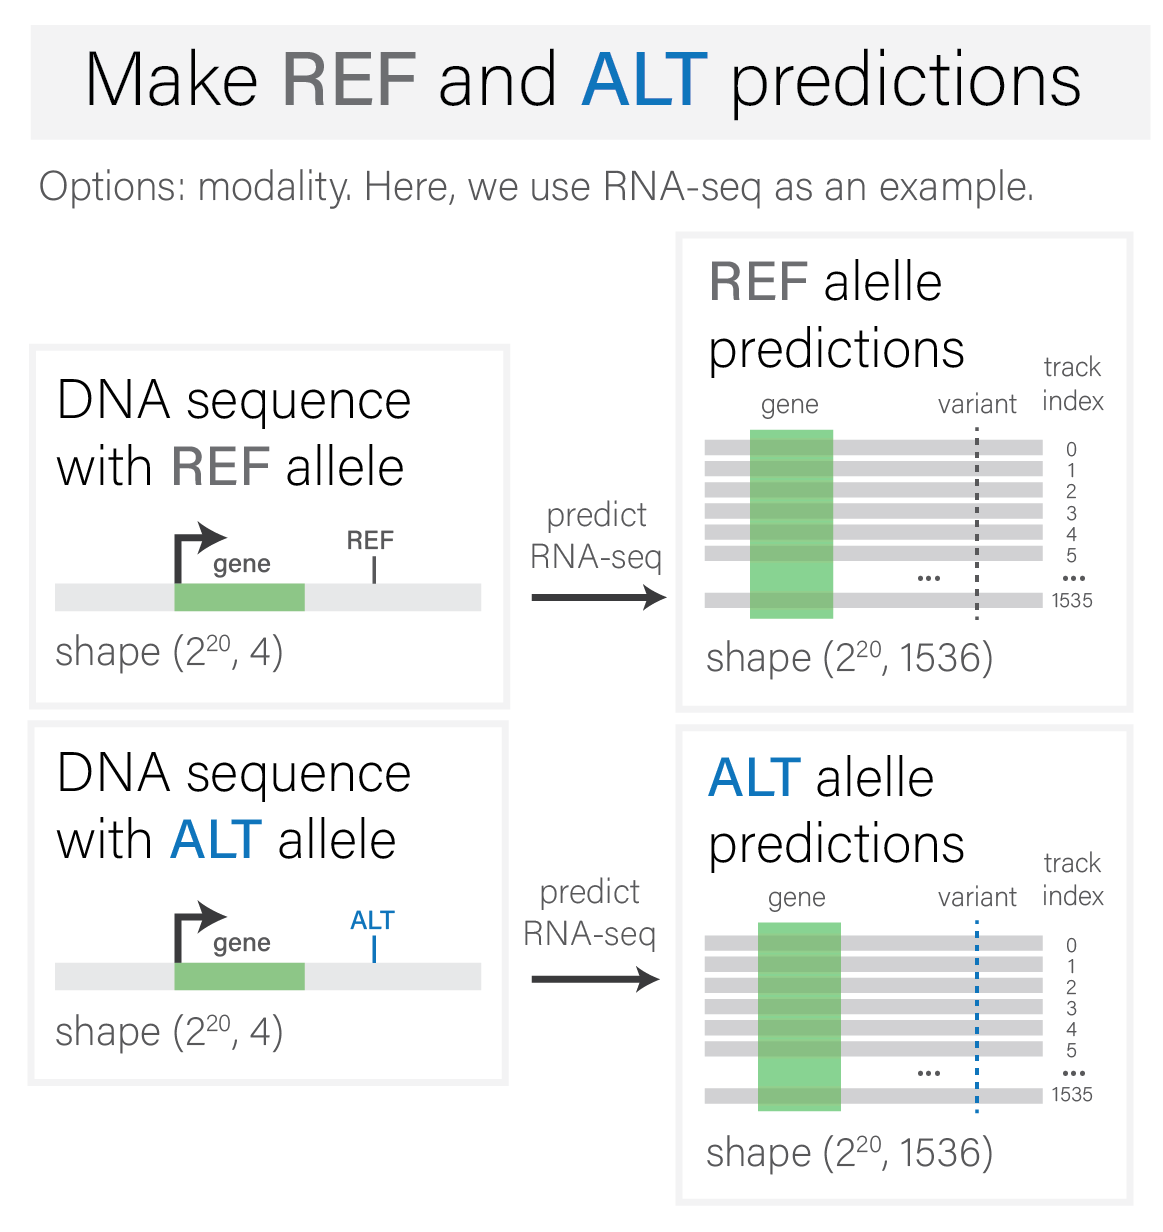
Make REF and ALT predictions for given modality#
Variant scoring begins by generating predictions for both the reference and
alternative alleles of a variant, restricted to a given modality of interest
(ex: RNA-SEQ, ATAC, etc.).
The model input at this stage are REF and ALT sequences, whose sequence
interval contains the variant of interest.
Optional - perform indel alignment#
For insertion or deletion (indel) variants, the ALT allele’s prediction
profile is aligned to the REF allele’s coordinate space. Inserted bases are
summarized by taking the maximum value over the inserted segment, while deleted
bases are treated as having zero signal in the ALT context, thereby enabling
consistent positional comparisons.
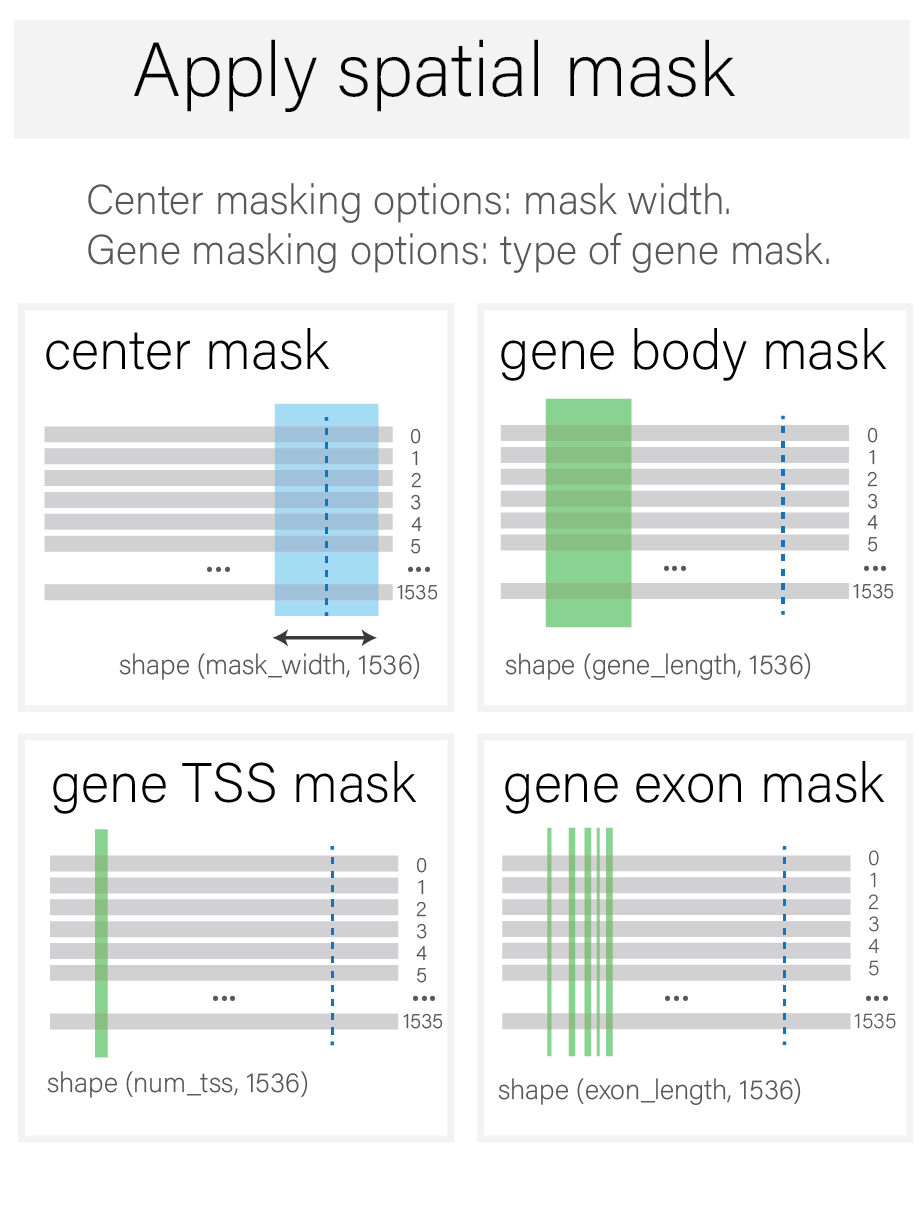
Apply spatial mask#
A spatial mask defines regions of interest within the interval containing the variant. This mask can be centered on the variant or encompass a gene (gene body, exons, or TSS, based on annotations from a GTF file).
At this stage, values outside of the mask are discarded.
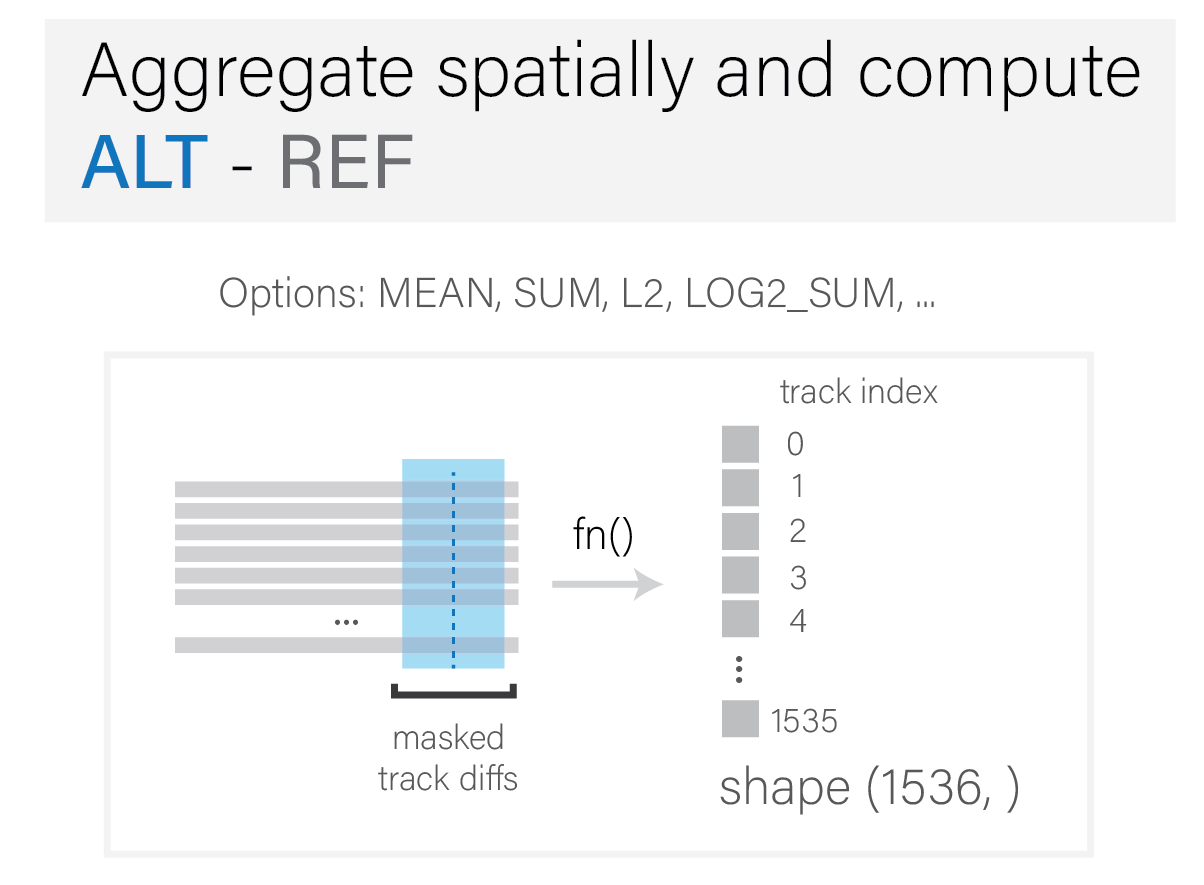
Aggregate spatially and compute ALT - REF#
Aggregation occurs at this stage, which includes the following:
reduction along the spatial axis, using
meanorsum, etc.(optional) scaling, such as a \(log\) or \(l^2\) transform.
difference between
ALT - REF.
The final outcome is a single scalar value per track.
Note
Aggregation logic is encapsulated in the options listed in
AggregationType.
The naming of the options reflects the order of operations of each of the above steps, with the right-most operation applied first to the model predictions.
For example,
DIFF_SUM_LOG2,
applies a log transform, then a sum, to track data. It then returns the
difference between ALT - REF.
Some aggregation options may apply the exact same steps, but in a different order.
Regardless of the order of operations, each aggregation type returns one single scalar value per track.
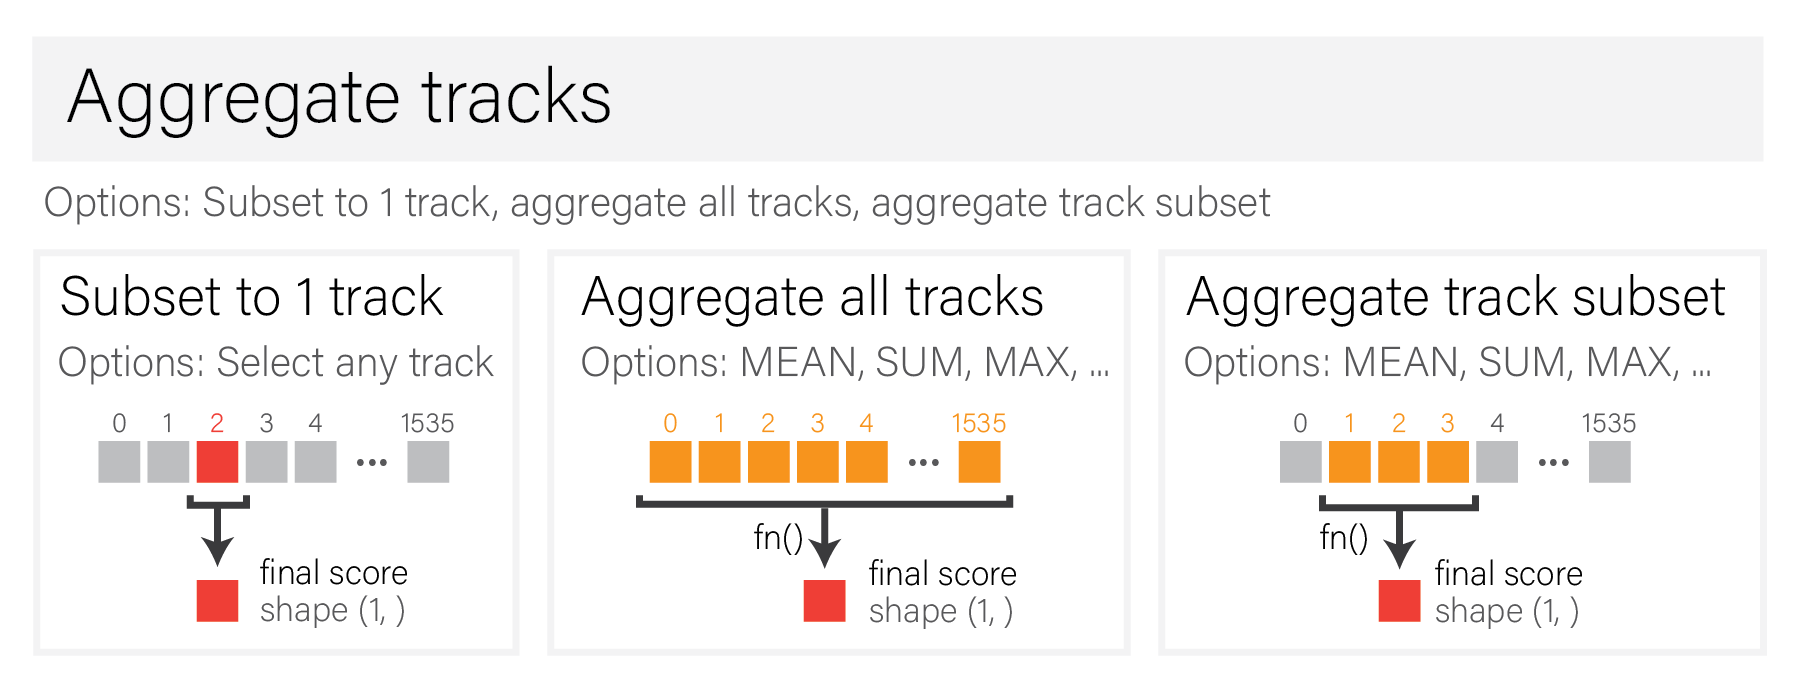
Optional - aggregate tracks#
After variant scoring is completed, optional track selection and additional aggregation can be applied.
Suggestions include additional aggregation (mean, max, sum, etc.) over:
All tracks.
Subsets of tracks.
Or, a single track of interest can be chosen, i.e., from a particular sample.
Modality-specific recommended variant scorers#
We have established a set of recommended variant scorers, available via
get_recommended_scorers(), covering
diverse genomic modalities as outlined below:
Gene Expression (RNA-seq)#
Variant scores quantify the impact on overall gene transcript abundance.
comparison: predicted RNA coverage between
REFandALTalleles.mask: exons for a gene of interest.
aggregation: Log-fold change of gene expression level between the
ALTandREFalleles: \(\log(mean(ALT) + 0.001) - log(mean(REF) + 0.001)\).
Polyadenylation Site (PAS) Usage#
This follows Borzoi’s [Linder et al., 2025] methodology for scoring polyadenylation quantitative trait loci (paQTLs), which captures the variant’s impact on RNA isoform production.
comparison: predicted RNA coverage between
REFandALTalleles.mask: local 400-bp windows around 3’ cleavage junctions.
aggregation: Maximum absolute log-fold change of isoform ratios (distal/proximal PAS usage) between
REFandALT, considering all proximal/distal splits.
TSS Activity (CAGE, PRO-cap)#
Variant scores quantify local changes at TSSs.
comparison: predicted CAGE or PRO-cap coverage between
REFandALTalleles.mask: local 501-bp window centered at the variant.
aggregation: Log2-ratio of summed signals: \(log2[(sum(ALT) + 1) / (sum(REF) + 1)]\).
Chromatin Accessibility (ATAC-seq, DNase-seq)#
Variant scores quantify local accessibility changes.
comparison: predicted ATAC-seq or DNase-cap coverage between
REFandALTalleles.mask: local 501-bp window centered at the variant.
aggregation: Log2-ratio of summed signals: \(log2[(sum(ALT) + 1) / (sum(REF) + 1)]\).
Transcription Factor Binding (ChIP-TF)#
Variant scores quantify changes in TF binding intensity.
comparison: predicted ChIP-TF coverage between
REFandALTalleles.mask: local 501-bp window centered at the variant.
aggregation: Log2-ratio of summed signals: \(log2[(sum(ALT) + 1) / (sum(REF) + 1)]\).
Histone Modifications (ChIP-Histone)#
Variant scores quantify changes in histone modifications.
comparison: predicted ChIP-Histone coverage between
REFandALTalleles.mask: local 2001-bp window centered at the variant.
aggregation: Log2-ratio of summed signals: \(log2[(sum(ALT) + 1) / (sum(REF) + 1)]\).
Splicing (Splice Sites)#
Variant scores quantify changes in the class assignment probabilities (acceptor, donor) at all potential splice sites within a gene body.
comparison: class assignment probabilities for
REFandALTalleles.mask: gene body for a gene of interest.
aggregation: Maximum absolute difference of predicted splice site probabilities across the gene body: \(max(|ALT - REF|)\).
Splicing (Splice Site Usage)#
Variant scores quantify changes in the usage of splice sites (i.e., increased or decreased fractions).
comparison: predicted splice site usage between
REFandALTalleles.mask: gene body for a gene of interest.
aggregation: Maximum absolute difference of predicted splice site usage across the gene body: \(max(|ALT - REF|)\).
Splicing (Splice Junctions)#
Variant scores quantify changes in the predicted RNA-seq reads spanning a junction, which is a function of both expression level, splice site usage and splicing efficiency.
comparison: predicted paired junction counts between
REFandALTalleles.mask: top-k splice sites for a gene of interest (including annotated and predicted splice sites).
aggregation: Maximum absolute log-fold change of predicted junction counts across splice site pairs of interest: \(max(|log(ALT) - log(REF)|)\).
3D Genome Contact (Contact Maps)#
Variant scores quantify local contact disruption.
comparison: predicted contact frequencies between
REFandALTalleles.mask: local 1MB window centered at the variant.
aggregation: Mean absolute difference of contact frequencies, for all interactions involving the variant-containing bin.
Active Allele Scorers#
In addition to the differential scores described above, we also provide scoring
configurations that capture the absolute activity level associated with one of
the alleles, rather than quantifying the change between REF and ALT. This is
calculated by taking the maximum of the aggregated signals from the REF and
ALT alleles over the masked central window or gene region.
We provide recommended active allele scorers for the following modalities:
Gene expression (RNA-seq): \(max(mean(ALT), mean(REF))\) across exons for a gene of interest.
TSS activity (CAGE, PRO-cap): \(max(sum(ALT), sum(REF))\) within a local 501-bp window centered at the variant.
Chromatin Accessibility (ATAC-seq, DNase-seq): \(max(sum(ALT), sum(REF))\) within a local 501-bp window centered at the variant.
Transcription Factor binding (ChIP-TF): \(max(sum(ALT), sum(REF))\) within a local 501-bp window centered at the variant.
Histone modifications (ChIP-Histone): \(max(sum(ALT), sum(REF))\) within a local 2001-bp window centered at the variant.
Available variant scorers#
For more on the types of variant scorers and how they work, visit the API documentation.
For a hands-on tutorial on scoring variants on their splicing effect, see the splicing variant scoring notebook.