
Working with imputed tracks#
Experimental functional genomics atlases often have uneven assay coverage across
tissues and primary cell types. Single-cell assays (scRNA-seq and scATAC-seq)
cover many human primary cell types, whereas histone ChIP-seq (H3K27ac,
H3K27me3) is often missing outside well-profiled tissues such as blood.
AlphaGenome 2 predicts every track for every reference condition (condition=)
and labels each track with its imputation_mode. To condition predictions on
your own scRNA-seq count matrix instead, see
Conditioning on your own single-cell data.
Here we inspect observed versus imputed chromatin tracks around TCF7 (encoding TCF-1, a master regulator of T-cell development and immune responses) across peripheral blood and bone marrow CD4+ T cells and B cells.
Set up#
# @title Install AlphaGenome

# @markdown Run this cell to install AlphaGenome.
from IPython.display import clear_output
! pip install alphagenome
clear_output()
Store your API key in Colab Secrets for persistent access across sessions (see Installation).
from alphagenome import colab_utils
from alphagenome.data import gene_annotation
from alphagenome.data import track_data
from alphagenome.data import transcript as transcript_utils
from alphagenome.models.v2 import dna_client
from alphagenome.visualization import plot_components
from IPython.display import display
import matplotlib.pyplot as plt
import pandas as pd

plt.rcParams['figure.facecolor'] = 'white'
plt.rcParams['savefig.facecolor'] = 'white'
plt.rcParams['savefig.transparent'] = False
dna_model = dna_client.create(colab_utils.get_api_key())
Load TCF7 annotations#
We load GENCODE v46 (hg38) MANE Select transcripts and define a 1 Mb
model input window (sequence_interval) and a 51.2 kb plotting window
(plot_window) centered on TCF7:
HG38_GTF_FEATHER = (
    'https://storage.googleapis.com/alphagenome/reference/gencode/'
    'hg38/gencode.v46.annotation.gtf.gz.feather'
)
gtf = pd.read_feather(HG38_GTF_FEATHER)
gtf_mane = gene_annotation.filter_to_mane_select_transcript(gtf)
transcript_extractor = transcript_utils.TranscriptExtractor(gtf_mane)

tcf7_interval = gene_annotation.get_gene_interval(gtf, gene_symbol='TCF7')
sequence_interval = tcf7_interval.resize(dna_client.SEQUENCE_LENGTH_1MB)
plot_window = tcf7_interval.resize(51_200)
mane_transcripts = transcript_extractor.extract(plot_window)
pair_colors = ['#1f77b4', '#d95f02']

print(f'TCF7 gene interval: {tcf7_interval}')
print(f'1 Mb model input  : {sequence_interval}')
print(f'51.2 kb plot view : {plot_window}')
TCF7 gene interval: chr5:134114680-134151865:+
1 Mb model input  : chr5:133608985-134657561:+
51.2 kb plot view : chr5:134107673-134158873:+
Check modality coverage across blood and bone marrow#
Calling dna_model.supported_conditions() summarizes whether each output type is
observed, imputed_supported, or imputed_exploratory for every reference
condition (see
Navigating imputed tracks
for how these modes are defined and pitfalls to avoid).
We compare peripheral blood (UBERON:0000178), where histone ChIP-seq was
experimentally measured, against bone marrow (UBERON:0002371), where only
single-cell assays (scATAC-seq and scRNA-seq) were measured and CHIP_HISTONE is
imputed_supported:
supported = dna_model.supported_conditions()

conditions = {
    'Blood Naive CD4+ T': 'UBERON:0000178_CL:0000895',
    'Blood CD4+ T': 'UBERON:0000178_CL:0000624',
    'Blood B': 'UBERON:0000178_CL:0000236',
    'Bone Marrow Naive CD4+ T': 'UBERON:0002371_CL:0000895',
    'Bone Marrow Naive B': 'UBERON:0002371_CL:0000788',
}
modality_cols = ['sc_atac', 'sc_gene_expression', 'chip_histone']
subset = supported[supported['condition'].isin(conditions.values())][
    ['condition', 'biosample_name'] + modality_cols
].sort_values('condition')

display(subset.reset_index(drop=True))
| condition | biosample_name | sc_atac | sc_gene_expression | chip_histone | |
|---|---|---|---|---|---|
| 0 | UBERON:0000178_CL:0000236 | blood B cell | observed | observed | observed |
| 1 | UBERON:0000178_CL:0000624 | blood CD4-positive, alpha-beta T cell | imputed_supported | imputed_supported | observed |
| 2 | UBERON:0000178_CL:0000895 | blood naive thymus-derived CD4-positive, alpha... | observed | observed | observed |
| 3 | UBERON:0002371_CL:0000788 | bone marrow naive B cell | observed | observed | imputed_supported |
| 4 | UBERON:0002371_CL:0000895 | bone marrow naive thymus-derived CD4-positive,... | observed | observed | imputed_supported |
Predict tracks across conditions#
We run dna_model.predict_interval() for SC_ATAC and CHIP_HISTONE across
the five reference conditions (we include both naive and total blood CD4+ T
cells because H3K27ac is observed in blood naive CD4+ T cells while
H3K27me3 is observed in total blood CD4+ T cells):
outputs = [
    dna_client.OutputType.SC_ATAC,
    dna_client.OutputType.CHIP_HISTONE,
]

preds = {
    name: dna_model.predict_interval(
        sequence_interval, requested_outputs=outputs, condition=cond
    )
    for name, cond in conditions.items()
}
See Navigating imputed tracks for the rules governing within- and cross-modality imputation. Inspecting metadata['imputation_mode'] shows that blood conditions mix observed and imputed histone tracks (within-modality imputation), whereas every bone marrow histone track is imputed from that condition’s single-cell accessibility (cross-modality imputation):
summary_rows = []
for name, pred in preds.items():
  sc_meta = pred.sc_atac.metadata
  ch_meta = pred.chip_histone.metadata
  summary_rows.append({
      'Condition': name,
      'Biosample': sc_meta['biosample_name'].iloc[0],
      'sc_atac observed / total': (
          f"{(sc_meta['imputation_mode'] == 'observed').sum()}/{len(sc_meta)}"
      ),
      'chip_histone observed / total': (
          f"{(ch_meta['imputation_mode'] == 'observed').sum()}/{len(ch_meta)}"
      ),
  })

pd.DataFrame(summary_rows)
| Condition | Biosample | sc_atac observed / total | chip_histone observed / total | |
|---|---|---|---|---|
| 0 | Blood Naive CD4+ T | blood naive thymus-derived CD4-positive, alpha... | 1/5 | 4/43 |
| 1 | Blood CD4+ T | blood CD4-positive, alpha-beta T cell | 0/5 | 6/43 |
| 2 | Blood B | blood B cell | 1/5 | 11/43 |
| 3 | Bone Marrow Naive CD4+ T | bone marrow naive thymus-derived CD4-positive,... | 1/5 | 0/43 |
| 4 | Bone Marrow Naive B | bone marrow naive B cell | 1/5 | 0/43 |
Bone marrow 10x scATAC-seq#
First, we extract the 10x nuclear scATAC-seq tracks in bone marrow naive CD4+ T cells and naive B cells:
bm_sc_atac = track_data.concat([
    preds['Bone Marrow Naive CD4+ T'].sc_atac,
    preds['Bone Marrow Naive B'].sc_atac,
])
bm_sc_atac = bm_sc_atac.filter_tracks(
    bm_sc_atac.metadata['name'].str.contains('10X-cellranger').to_numpy()
)
_ = plot_components.plot(
    components=[
        plot_components.TranscriptAnnotation(mane_transcripts),
        plot_components.Tracks(
            bm_sc_atac,
            ylabel_template=(
                '{biosample_name}\n{Assay title} [{imputation_mode}]'
            ),
            shared_y_scale=True,
            filled=True,
            track_colors=pair_colors,
        ),
    ],
    interval=plot_window,
    title='TCF7 locus: bone marrow observed scATAC-seq (10X)',
)
plt.show()

Active mark (H3K27ac): observed blood vs imputed bone marrow#
We keep single-end H3K27ac tracks, the channel observed in blood, and plot observed blood (top) above imputed bone marrow (bottom):
blood_k27ac = track_data.concat([
    preds['Blood Naive CD4+ T'].chip_histone,
    preds['Blood B'].chip_histone,
])
blood_k27ac = blood_k27ac.filter_tracks(
    (
        (blood_k27ac.metadata['histone_mark'] == 'H3K27ac')
        & (blood_k27ac.metadata['endedness'] == 'single')
    ).to_numpy()
)

bm_k27ac = track_data.concat([
    preds['Bone Marrow Naive CD4+ T'].chip_histone,
    preds['Bone Marrow Naive B'].chip_histone,
])
bm_k27ac = bm_k27ac.filter_tracks(
    (
        (bm_k27ac.metadata['histone_mark'] == 'H3K27ac')
        & (bm_k27ac.metadata['endedness'] == 'single')
    ).to_numpy()
)
_ = plot_components.plot(
    components=[
        plot_components.TranscriptAnnotation(mane_transcripts),
        plot_components.Tracks(
            blood_k27ac,
            ylabel_template=(
                '{biosample_name}\n{histone_mark} [{imputation_mode}]'
            ),
            shared_y_scale=True,
            filled=True,
            track_colors=pair_colors,
        ),
        plot_components.Tracks(
            bm_k27ac,
            ylabel_template=(
                '{biosample_name}\n{histone_mark} [{imputation_mode}]'
            ),
            shared_y_scale=True,
            filled=True,
            track_colors=pair_colors,
        ),
    ],
    interval=plot_window,
    title='TCF7 locus H3K27ac: observed blood vs imputed bone marrow',
)
plt.show()
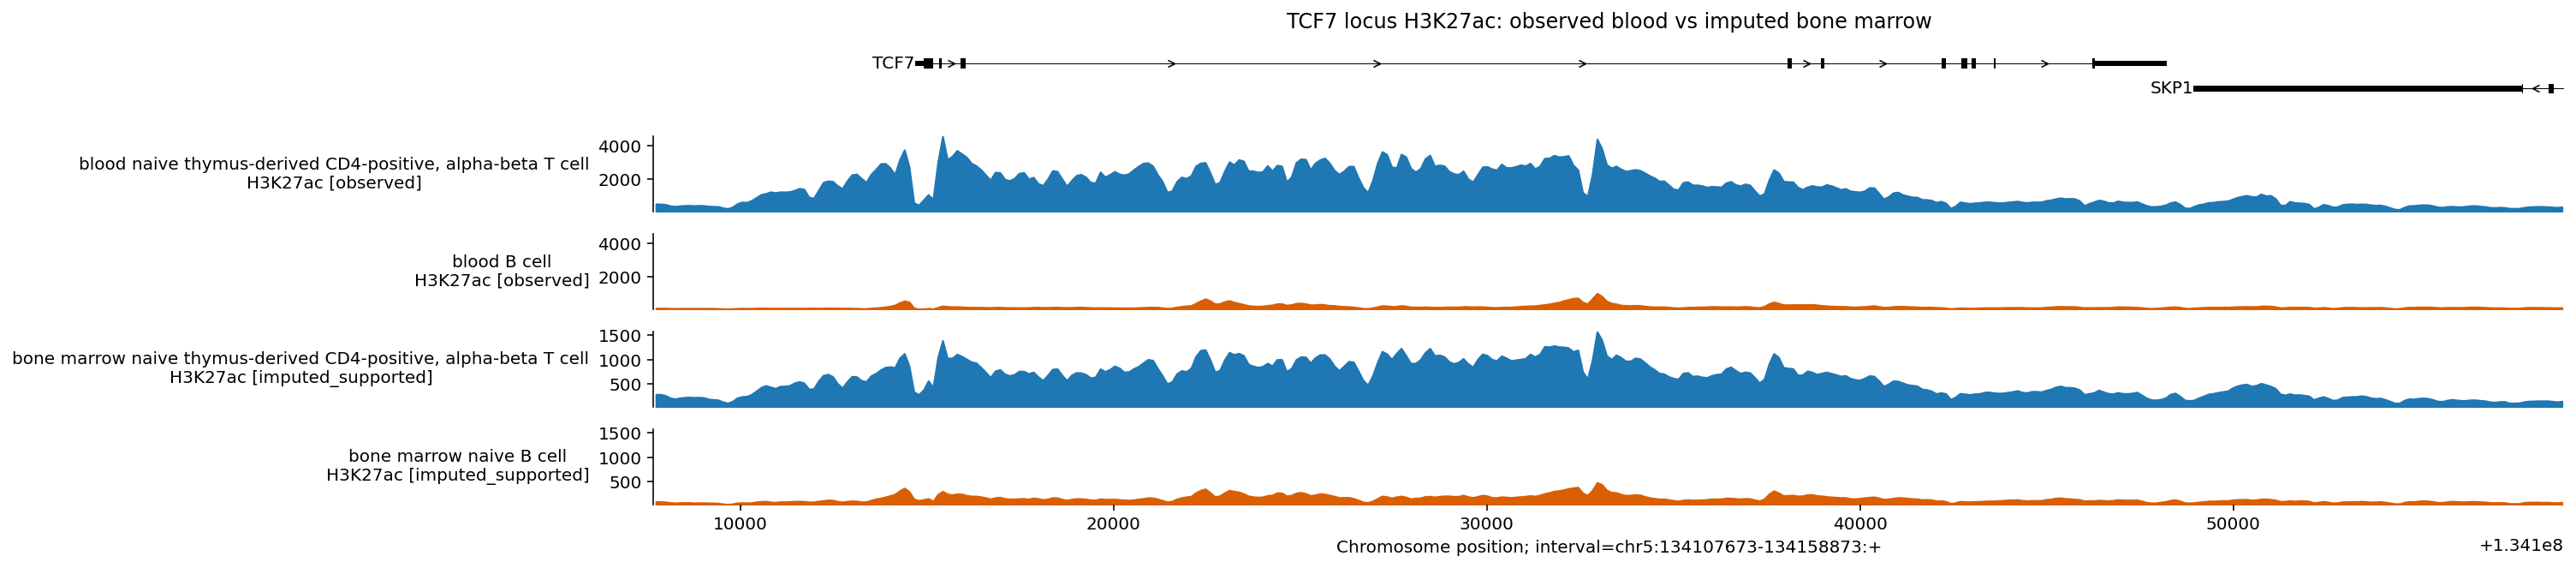
Imputed bone marrow H3K27ac in naive CD4+ T cells (bottom, blue) resembles the broad acetylation domain spanning TCF7 seen in observed blood CD4+ T cells (top, blue), while B cells (orange) remain nearer to baseline in both tissues.
Repressive mark (H3K27me3): observed blood vs imputed bone marrow#
We repeat the comparison for H3K27me3, which is observed in total blood CD4+ T cells and B cells:
blood_k27me3 = track_data.concat([
    preds['Blood CD4+ T'].chip_histone,
    preds['Blood B'].chip_histone,
])
blood_k27me3 = blood_k27me3.filter_tracks(
    (
        (blood_k27me3.metadata['histone_mark'] == 'H3K27me3')
        & (blood_k27me3.metadata['endedness'] == 'single')
    ).to_numpy()
)

bm_k27me3 = track_data.concat([
    preds['Bone Marrow Naive CD4+ T'].chip_histone,
    preds['Bone Marrow Naive B'].chip_histone,
])
bm_k27me3 = bm_k27me3.filter_tracks(
    (
        (bm_k27me3.metadata['histone_mark'] == 'H3K27me3')
        & (bm_k27me3.metadata['endedness'] == 'single')
    ).to_numpy()
)
_ = plot_components.plot(
    components=[
        plot_components.TranscriptAnnotation(mane_transcripts),
        plot_components.Tracks(
            blood_k27me3,
            ylabel_template=(
                '{biosample_name}\n{histone_mark} [{imputation_mode}]'
            ),
            shared_y_scale=True,
            filled=True,
            track_colors=pair_colors,
        ),
        plot_components.Tracks(
            bm_k27me3,
            ylabel_template=(
                '{biosample_name}\n{histone_mark} [{imputation_mode}]'
            ),
            shared_y_scale=True,
            filled=True,
            track_colors=pair_colors,
        ),
    ],
    interval=plot_window,
    title='TCF7 locus H3K27me3: observed blood vs imputed bone marrow',
)
plt.show()
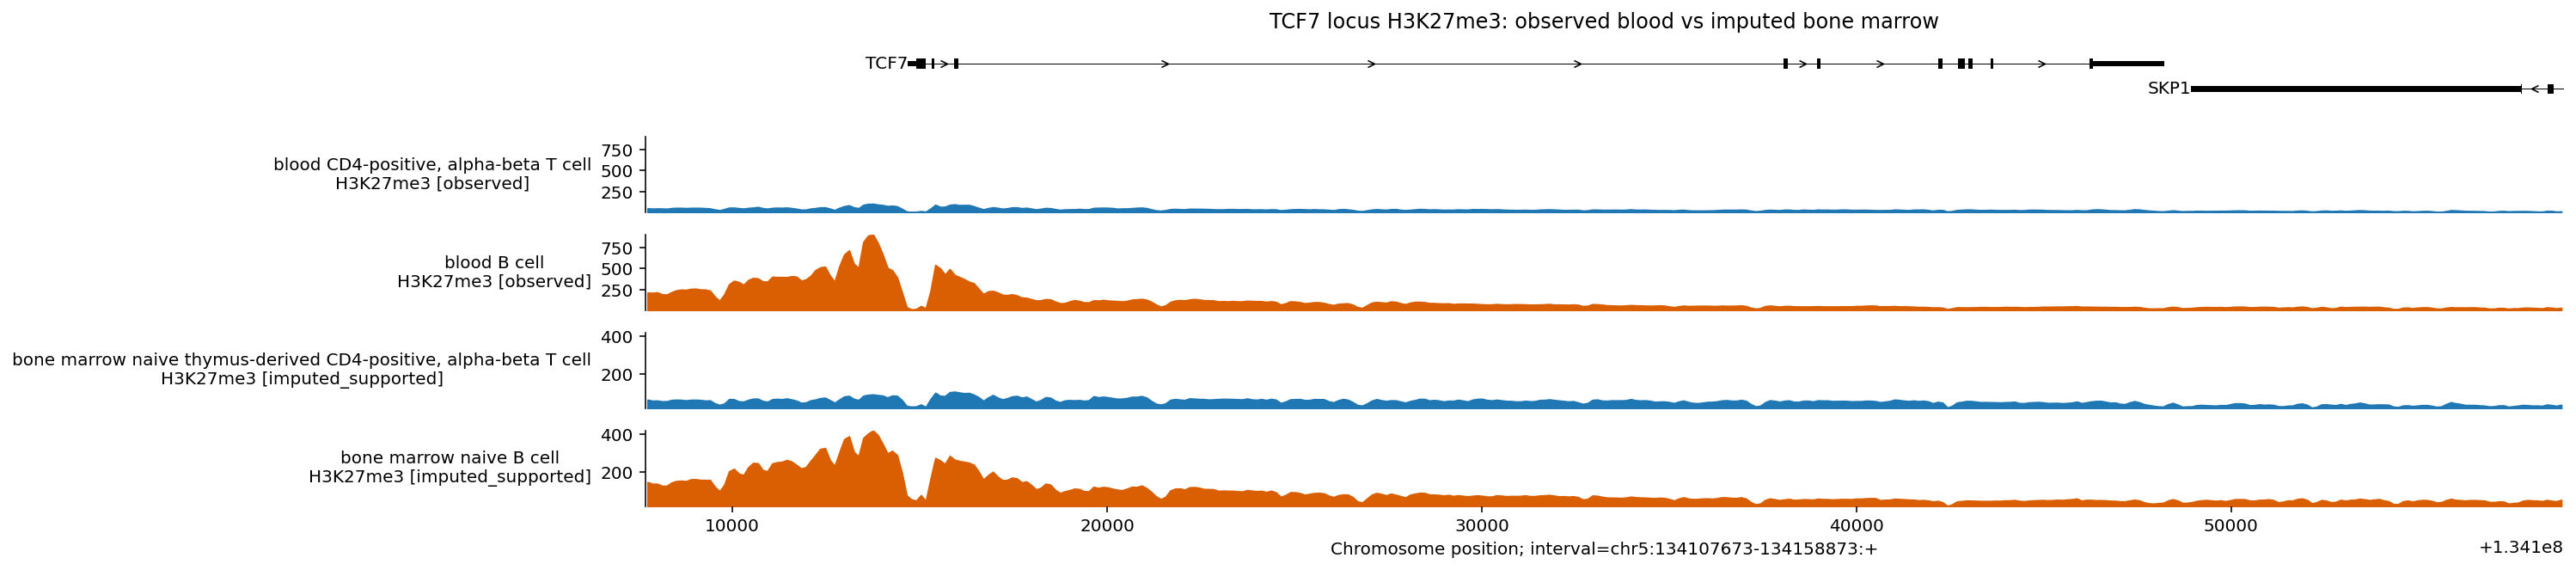
Imputed bone marrow H3K27me3 in naive B cells (bottom, orange) resembles the focal Polycomb-repressive peak over the TCF7 promoter seen in observed blood B cells (top, orange), while CD4+ T cells (blue) remain closer to zero. Histone marks imputed from chromatin accessibility follow a supported direction; see Navigating imputed tracks for more information.
Next steps#
See Navigating imputed tracks for imputation modes and reliability caveats.
See Conditioning on your own single-cell data to condition predictions on your own scRNA-seq counts.