Visualization basics#
AlphaGenome predicts several output types with different data shapes and
resolutions: 1D genomic tracks (TrackData), sparse splice junctions
(JunctionData), 2D chromatin contact maps (TrackData), and, in AlphaGenome 2
only, gene-level single-cell expression tables (GeneExpressionData). The
alphagenome.visualization package builds multi-panel
matplotlib figures that align these outputs along a shared genomic coordinate
axis.
Tip
For worked examples across every modality, see the Plotting predictions tutorial.
Assembling a figure with plot#
plot() takes a sequence of
components, a target Interval, and optional
annotations, and returns a matplotlib.figure.Figure:
from alphagenome.visualization import plot_components

fig = plot_components.plot(
    components=[
        plot_components.TranscriptAnnotation(transcripts),
        plot_components.Tracks(output.atac),
        plot_components.GeneExpression(output.sc_gene_expression_denoised),
    ],
    interval=interval,
    annotations=[plot_components.VariantAnnotation([variant])],
)
Each component in components renders as one vertically stacked panel (or one
panel per track) with its own y-axis and a shared base-pair x-axis cropped to
interval (figure).
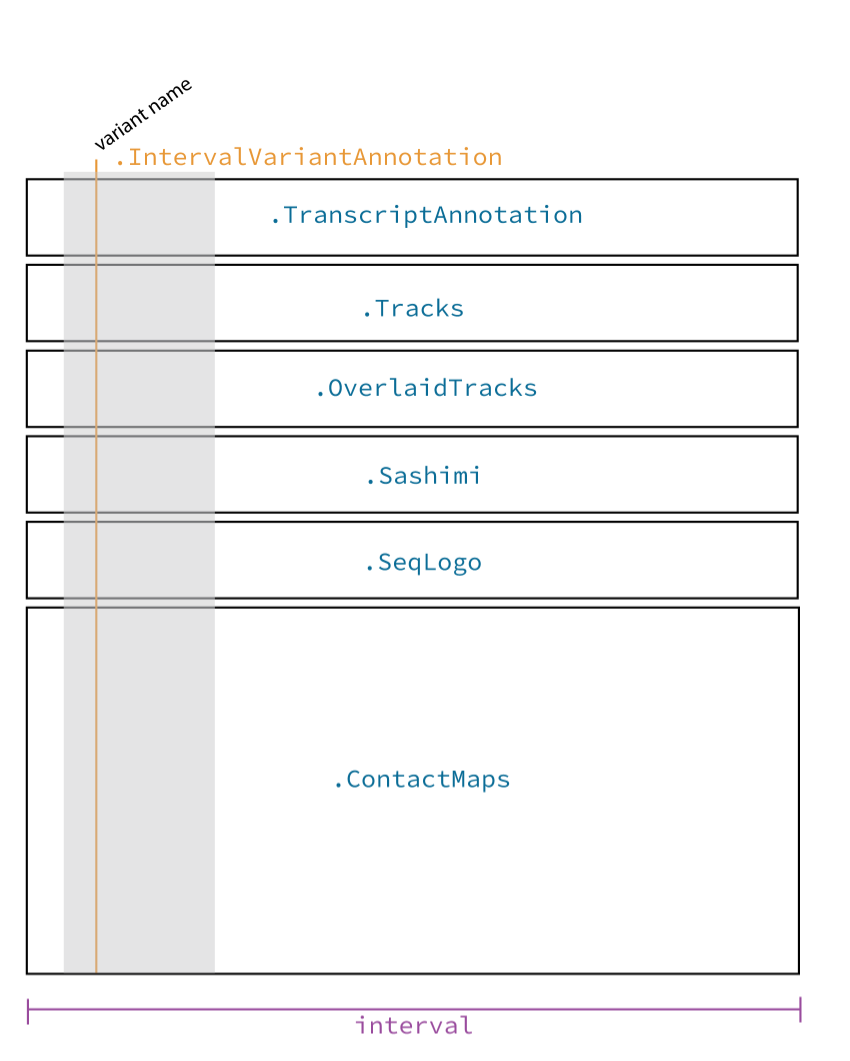
Anatomy of a plot_components.plot figure. Blue labels show component and
annotation classes; purple labels show plot() arguments that control
figure-wide layout.#
Components and annotations#
Each component class wraps a model output container (or custom data placed in
TrackData, GeneExpressionData, or JunctionData) and controls panel-level
aesthetics such as colors, y-axis scaling (shared_y_scale, global_ylims),
and y-axis label templates (ylabel_template).
Class |
Input container |
Recommended outputs |
Description |
|---|---|---|---|
|
Positional tracks ( |
Line or filled-area profile across genomic coordinates, one subplot per track. |
|
|
|
Overlays two or more |
|
|
|
Horizontal gene-span bars showing scalar gene-level expression (in CPM, or
|
|
|
|
Overlays two or more |
|
|
|
Arcs connecting splice donor and acceptor coordinates, with arc thickness and optional labels showing normalized junction read counts. |
|
|
Enhancer-to-gene links from
|
Cubic Bezier arcs connecting candidate enhancer intervals to target gene TSS coordinates, optionally colored or scaled by enhancer score. |
|
|
|
Pairwise 2D heatmap of chromatin contact frequencies across genomic bins. |
|
|
|
Pairwise 2D heatmap with a zero-centered diverging colormap ( |
|
|
ISM contribution scores |
Nucleotide sequence logo where letter heights reflect per-base attribution or in silico mutagenesis scores. |
|
|
GENCODE / GTF transcripts |
Horizontal gene and isoform models showing exons, introns, coding regions, and strand direction. |
|
|
Variant positions |
Vertical highlight lines spanning all panels at each variant coordinate, with optional angled labels at the top of the figure. |
|
|
Candidate regulatory elements, exons, or ROIs |
Shaded vertical bands spanning all panels across each genomic interval, with optional labels. |
Custom components#
To define a custom panel type or cross-panel overlay, subclass
AbstractComponent
(implementing num_axes, get_ax_height, and plot_ax) or
AbstractAnnotation
(implementing plot_ax and plot_labels).