
Analyzing a splicing variant#
Variants can alter how a gene is spliced, not only how much it is expressed. This tutorial uses AlphaGenome 2 to predict, visualize, and score a splicing variant: chr22:36201698:A>C at APOL4 in sigmoid colon (UBERON:0001159), an example highlighted in the AlphaGenome 1 quick start (legacy) and Avsec et al. [2026].
Key activities:
Inspect how AlphaGenome 2 represents splicing outputs and verify their measurement status in sigmoid colon.
Predict REF and ALT tracks for
RNA_SEQ,SPLICE_SITES,SPLICE_SITE_USAGE, andSPLICE_JUNCTIONS.Plot negative-strand junction arcs (
plot_components.Sashimi) alongside overlaid splice site usage and RNA-seq coverage.Score the variant across the recommended splicing and RNA-seq variant scorers.
Set up#
# @title Install AlphaGenome

# @markdown Run this cell to install AlphaGenome.
from IPython.display import clear_output
! pip install alphagenome
clear_output()
# @title Imports
from alphagenome import colab_utils
from alphagenome.data import gene_annotation
from alphagenome.data import genome
from alphagenome.data import transcript as transcript_utils
from alphagenome.models.v2 import dna_client
from alphagenome.models.v2 import variant_scorers
from alphagenome.visualization import plot_components
import matplotlib.pyplot as plt
import pandas as pd
Store your API key in Colab Secrets for persistent access across sessions (see Installation), then initialize the client:
dna_model = dna_client.create(colab_utils.get_api_key())
Splicing outputs#
AlphaGenome 2 predicts splicing with three specialized output types, alongside bulk RNA-seq coverage, which also captures splicing patterns (see Model output metadata):
Output type |
Resolution |
Description |
|---|---|---|
|
1 bp |
Condition-specific classification probabilities across 5 channels (donor and acceptor on each strand plus non-splice-site padding), derived per condition from its RNA-seq splicing assays. |
|
1 bp |
Condition-specific fraction of transcripts spliced at each donor or acceptor site per RNA-seq track. |
|
Junction pairs |
Condition-specific split-read counts spanning donor-acceptor intron pairs. |
Check the imputation_mode status of RNA_SEQ and the three splicing output types in sigmoid colon (UBERON:0001159) via dna_model.supported_conditions():
condition = 'UBERON:0001159'  # Sigmoid colon.

dna_model.supported_conditions().set_index('condition').loc[
    condition,
    ['rna_seq', 'splice_sites', 'splice_site_usage', 'splice_junctions'],
]
rna_seq              observed
splice_sites         observed
splice_site_usage    observed
splice_junctions     observed
Name: UBERON:0001159, dtype: object
Load GENCODE gene annotations and construct a TranscriptExtractor across all protein-coding transcripts (rather than restricting to MANE Select alone) so alternative APOL4 isoforms are displayed:
gtf = pd.read_feather(
    'https://storage.googleapis.com/alphagenome/reference/gencode/'
    'hg38/gencode.v46.annotation.gtf.gz.feather'
)
gtf_transcripts = gene_annotation.filter_protein_coding(gtf)
transcript_extractor = transcript_utils.TranscriptExtractor(gtf_transcripts)
Predict the variant#
Center a 1 Mb sequence window (dna_client.SEQUENCE_LENGTH_1MB) around chr22:36201698:A>C (genome.Variant) and predict RNA_SEQ, SPLICE_SITES, SPLICE_SITE_USAGE, and SPLICE_JUNCTIONS for both REF and ALT alleles:
variant = genome.Variant(
    chromosome='chr22',
    position=36201698,
    reference_bases='A',
    alternate_bases='C',
)
interval = variant.reference_interval.resize(dna_client.SEQUENCE_LENGTH_1MB)

output = dna_model.predict_variant(
    interval=interval,
    variant=variant,
    requested_outputs=[
        dna_client.OutputType.RNA_SEQ,
        dna_client.OutputType.SPLICE_SITES,
        dna_client.OutputType.SPLICE_SITE_USAGE,
        dna_client.OutputType.SPLICE_JUNCTIONS,
    ],
    condition=condition,
)
Visualize splicing and expression changes#
We keep observed negative-strand GTEx tracks (output.reference.filter_to_observed()) and plot REF and ALT junction arcs (plot_components.Sashimi), splice site usage, and RNA-seq coverage across APOL4:
plot_interval = gene_annotation.get_gene_interval(gtf, gene_symbol='APOL4').pad(
    1000, 1000
)
obs_ref = output.reference.filter_to_observed()
obs_alt = output.alternate.filter_to_observed()

ref_j = obs_ref.splice_junctions.filter_to_strand('-')
alt_j = obs_alt.splice_junctions.filter_to_strand('-')
gtex_j_mask = (ref_j.metadata['data_source'] == 'gtex').values

ref_ssu = obs_ref.splice_site_usage.filter_to_negative_strand().slice_by_interval(
    plot_interval, match_resolution=True
)
alt_ssu = obs_alt.splice_site_usage.filter_to_negative_strand().slice_by_interval(
    plot_interval, match_resolution=True
)
gtex_ssu_mask = (ref_ssu.metadata['data_source'] == 'gtex').values

ref_rna = obs_ref.rna_seq.filter_to_negative_strand().slice_by_interval(
    plot_interval, match_resolution=True
)
alt_rna = obs_alt.rna_seq.filter_to_negative_strand().slice_by_interval(
    plot_interval, match_resolution=True
)
rna_mask = (
    (ref_rna.metadata['Assay title'] == 'polyA plus RNA-seq')
    & (ref_rna.metadata['endedness'] == 'paired')
).values

transcripts = transcript_extractor.extract(interval)
ref_alt_colors = {'REF': '#22AAE1', 'ALT': 'red'}

plot_components.plot(
    [
        plot_components.TranscriptAnnotation(transcripts),
        plot_components.Sashimi(
            ref_j.filter_tracks(gtex_j_mask),
            ylabel_template='REF junctions ({strand})\n{biosample_name}',
        ),
        plot_components.Sashimi(
            alt_j.filter_tracks(gtex_j_mask),
            ylabel_template='ALT junctions ({strand})\n{biosample_name}',
        ),
        plot_components.OverlaidTracks(
            tdata={
                'REF': ref_ssu.filter_tracks(gtex_ssu_mask),
                'ALT': alt_ssu.filter_tracks(gtex_ssu_mask),
            },
            colors=ref_alt_colors,
            ylabel_template='Splice site usage ({strand})\n{biosample_name}',
        ),
        plot_components.OverlaidTracks(
            tdata={
                'REF': ref_rna.filter_tracks(rna_mask),
                'ALT': alt_rna.filter_tracks(rna_mask),
            },
            colors=ref_alt_colors,
            ylabel_template='RNA-seq ({strand})\n{biosample_name}',
        ),
    ],
    interval=plot_interval,
    annotations=[plot_components.VariantAnnotation([variant], alpha=0.8)],
)
plt.show()
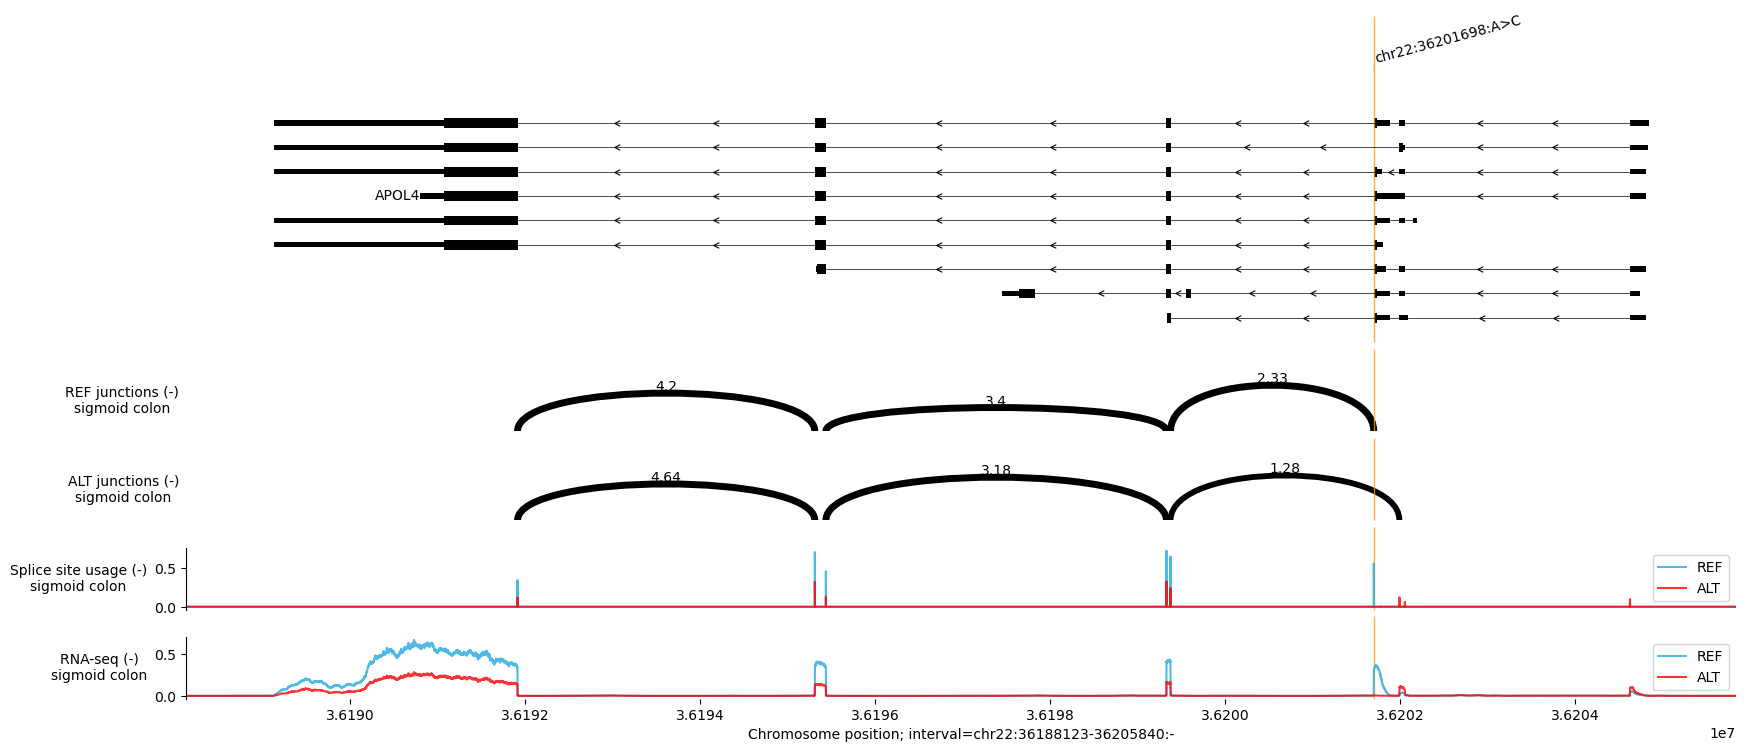
On the negative strand at APOL4, AlphaGenome 2 predicts that the ALT allele (C at chr22:36201698) suppresses the canonical splice junction adjacent to the variant, shifts split reads toward an upstream exon-skipping junction, reduces predicted donor splice-site usage at the disrupted exon boundary, and lowers exon RNA-seq coverage across APOL4.
Score the variant#
Quantify these effects across all three splicing scorers (SPLICE_SITES, SPLICE_SITE_USAGE, SPLICE_JUNCTIONS) together with RNA_SEQ from variant_scorers.RECOMMENDED_VARIANT_SCORERS, then format the per-gene results with variant_scorers.tidy_scores:
splicing_scorers = [
    variant_scorers.RECOMMENDED_VARIANT_SCORERS[name]
    for name in ('SPLICE_SITES', 'SPLICE_SITE_USAGE', 'SPLICE_JUNCTIONS')
]
scores = dna_model.score_variant(
    interval=interval,
    variant=variant,
    variant_scorers=[
        *splicing_scorers,
        variant_scorers.RECOMMENDED_VARIANT_SCORERS['RNA_SEQ'],
    ],
    condition=condition,
)
tidy = variant_scorers.tidy_scores(scores, match_gene_strand=True)
tidy[tidy['gene_name'] == 'APOL4']
| variant_id | scored_interval | gene_id | gene_name | gene_type | gene_strand | junction_Start | junction_End | output_type | variant_scorer | track_name | track_strand | imputation_mode | biosample_curie | biosample_type | biosample_name | splice_site_type | Assay title | data_source | data_pipeline | genetically_modified | endedness | raw_score | |
|---|---|---|---|---|---|---|---|---|---|---|---|---|---|---|---|---|---|---|---|---|---|---|---|
| 0 | chr22:36201698:A>C | chr22:35677410-36725986:. | ENSG00000100336 | APOL4 | protein_coding | - | None | None | SPLICE_SITES | GeneMaskSplicingScorer(requested_output=SPLICE_SITES, width=None) | UBERON:0001159_donor | . | observed | UBERON:0001159 | tissue | sigmoid colon | donor | NaN | NaN | NaN | NaN | NaN | 0.895063 |
| 1 | chr22:36201698:A>C | chr22:35677410-36725986:. | ENSG00000100336 | APOL4 | protein_coding | - | None | None | SPLICE_SITES | GeneMaskSplicingScorer(requested_output=SPLICE_SITES, width=None) | UBERON:0001159_acceptor | . | observed | UBERON:0001159 | tissue | sigmoid colon | acceptor | NaN | NaN | NaN | NaN | NaN | 0.255946 |
| 2 | chr22:36201698:A>C | chr22:35677410-36725986:. | ENSG00000100336 | APOL4 | protein_coding | - | None | None | SPLICE_SITE_USAGE | GeneMaskSplicingScorer(requested_output=SPLICE_SITE_USAGE, width=None) | UBERON:0001159_polyA plus RNA-seq-encode | . | observed | UBERON:0001159 | tissue | sigmoid colon | NaN | polyA plus RNA-seq | encode | encode | NaN | NaN | 0.593331 |
| 3 | chr22:36201698:A>C | chr22:35677410-36725986:. | ENSG00000100336 | APOL4 | protein_coding | - | None | None | SPLICE_SITE_USAGE | GeneMaskSplicingScorer(requested_output=SPLICE_SITE_USAGE, width=None) | UBERON:0001159_polyA plus RNA-seq-gtex | . | observed | UBERON:0001159 | tissue | sigmoid colon | NaN | polyA plus RNA-seq | gtex | recount3 | NaN | NaN | 0.556729 |
| 4 | chr22:36201698:A>C | chr22:35677410-36725986:. | ENSG00000100336 | APOL4 | protein_coding | - | None | None | SPLICE_SITE_USAGE | GeneMaskSplicingScorer(requested_output=SPLICE_SITE_USAGE, width=None) | UBERON:0001159_total RNA-seq-encode | . | observed | UBERON:0001159 | tissue | sigmoid colon | NaN | total RNA-seq | encode | encode | NaN | NaN | 0.566698 |
| 5 | chr22:36201698:A>C | chr22:35677410-36725986:. | ENSG00000100336 | APOL4 | protein_coding | - | 36199376 | 36201699 | SPLICE_JUNCTIONS | SpliceJunctionScorer() | UBERON:0001159_polyA plus RNA-seq-encode | . | observed | UBERON:0001159 | tissue | sigmoid colon | NaN | polyA plus RNA-seq | encode | encode | NaN | NaN | 5.640625 |
| 6 | chr22:36201698:A>C | chr22:35677410-36725986:. | ENSG00000100336 | APOL4 | protein_coding | - | 36199376 | 36201699 | SPLICE_JUNCTIONS | SpliceJunctionScorer() | UBERON:0001159_polyA plus RNA-seq-gtex | . | observed | UBERON:0001159 | tissue | sigmoid colon | NaN | polyA plus RNA-seq | gtex | recount3 | NaN | NaN | 5.792969 |
| 7 | chr22:36201698:A>C | chr22:35677410-36725986:. | ENSG00000100336 | APOL4 | protein_coding | - | 36199376 | 36201699 | SPLICE_JUNCTIONS | SpliceJunctionScorer() | UBERON:0001159_total RNA-seq-encode | . | observed | UBERON:0001159 | tissue | sigmoid colon | NaN | total RNA-seq | encode | encode | NaN | NaN | 5.699219 |
| 13 | chr22:36201698:A>C | chr22:35677410-36725986:. | ENSG00000100336 | APOL4 | protein_coding | - | None | None | RNA_SEQ | GeneMaskLFCScorer(requested_output=RNA_SEQ, aggregation_type=DIFF_MEAN) | UBERON:0001159_polyA plus RNA-seq-encode-paired-ended | . | observed | UBERON:0001159 | tissue | sigmoid colon | NaN | polyA plus RNA-seq | encode | encode | False | paired | -0.893399 |
| 14 | chr22:36201698:A>C | chr22:35677410-36725986:. | ENSG00000100336 | APOL4 | protein_coding | - | None | None | RNA_SEQ | GeneMaskLFCScorer(requested_output=RNA_SEQ, aggregation_type=DIFF_MEAN) | UBERON:0001159_polyA plus RNA-seq-encode-single-ended | . | imputed_supported | UBERON:0001159 | tissue | sigmoid colon | NaN | polyA plus RNA-seq | NaN | encode | NaN | single | -1.041781 |
| 15 | chr22:36201698:A>C | chr22:35677410-36725986:. | ENSG00000100336 | APOL4 | protein_coding | - | None | None | RNA_SEQ | GeneMaskLFCScorer(requested_output=RNA_SEQ, aggregation_type=DIFF_MEAN) | UBERON:0001159_total RNA-seq-encode-paired-ended | . | observed | UBERON:0001159 | tissue | sigmoid colon | NaN | total RNA-seq | encode | encode | False | paired | -1.595810 |
| 16 | chr22:36201698:A>C | chr22:35677410-36725986:. | ENSG00000100336 | APOL4 | protein_coding | - | None | None | RNA_SEQ | GeneMaskLFCScorer(requested_output=RNA_SEQ, aggregation_type=DIFF_MEAN) | UBERON:0001159_total RNA-seq-encode-single-ended | . | imputed_supported | UBERON:0001159 | tissue | sigmoid colon | NaN | total RNA-seq | NaN | encode | NaN | single | -1.391649 |
| 17 | chr22:36201698:A>C | chr22:35677410-36725986:. | ENSG00000100336 | APOL4 | protein_coding | - | None | None | RNA_SEQ | GeneMaskLFCScorer(requested_output=RNA_SEQ, aggregation_type=DIFF_MEAN) | UBERON:0001159_polyA plus RNA-seq-gtex-paired-ended | . | observed | UBERON:0001159 | tissue | sigmoid colon | NaN | polyA plus RNA-seq | gtex | recount3 | False | paired | -1.349591 |
Combine the splicing scores#
Following the splicing variant benchmarks in Avsec et al. [2026], we can combine the maximum magnitude across genes and observed tracks for each of the three splicing output types into a single merged splicing score per variant:
Giving weight 0.2 (1 / 5) to SPLICE_JUNCTIONS accounts for the larger scale of junction log-fold changes relative to probability differences ([0, 1]).
Note
Multi-tissue ensembling: Each AlphaGenome 2 call scores one
conditionat a time. In AlphaGenome 1 (alphagenome.models.v1),score_variantevaluates all observed biosamples simultaneously; scoring or taking the maximum across multiple relevant tissues can improve sensitivity for tissue-restricted splice variants.Imputed splicing tracks: Filter to
imputation_mode == "observed"when available, as imputedSPLICE_SITE_USAGEandSPLICE_JUNCTIONStracks carry additional caveats; see Navigating imputed tracks.
def compute_merged_splicing_score(df: pd.DataFrame) -> pd.DataFrame:
  """Computes the merged splicing score across observed tracks per variant."""
  obs_df = df[df['imputation_mode'] == 'observed'].copy()
  obs_df['variant_id'] = obs_df['variant_id'].map(str)
  obs_df['abs_raw_score'] = obs_df['raw_score'].abs()
  max_scores = (
      obs_df.groupby(['variant_id', 'output_type'])['abs_raw_score']
      .max()
      .reset_index()
      .pivot(index='variant_id', columns='output_type', values='abs_raw_score')
      .fillna(0.0)
  )
  max_scores['alphagenome_splicing'] = (
      max_scores.get('SPLICE_SITES', 0.0)
      + max_scores.get('SPLICE_SITE_USAGE', 0.0)
      + max_scores.get('SPLICE_JUNCTIONS', 0.0) / 5.0
  )
  return max_scores.reset_index()


compute_merged_splicing_score(tidy)
| output_type | variant_id | RNA_SEQ | SPLICE_JUNCTIONS | SPLICE_SITES | SPLICE_SITE_USAGE | alphagenome_splicing |
|---|---|---|---|---|---|---|
| 0 | chr22:36201698:A>C | 1.59581 | 5.792969 | 0.895063 | 0.593331 | 2.646988 |
Next steps#
See Deriving PSI values from splice junctions to compute percent spliced in (PSI5 and PSI3) ratios from
JunctionDatapredictions.Explore additional track and junction plotting layouts in Plotting predictions.
Read How variant scoring works for details on spatial aggregation and gene masks across scorers.