
Plotting predictions#
The plot_components module builds a figure from a list of panels stacked over
a shared genomic interval. Pass the panels and the interval to
plot_components.plot, which returns a matplotlib figure you can save with
fig.savefig.
Panels fall into two groups:
Annotations mark genes, variants, and other intervals:
TranscriptAnnotation,VariantAnnotation, andIntervalAnnotation.Data panels show predictions:
Tracksfor coverage,GeneExpressionfor gene-level single-cell expression,Sashimifor splice junctions, andContactMapsfor 3D contacts. Overlaid versions compare REF and ALT alleles on the same axes.
Track labels are built from track metadata with ylabel_template, for example
'{biosample_name} ({strand})'.
For variant overlays and splice junction arcs in context, see Predicting a variant and Analyzing a splicing variant. The Visualization API reference lists every component and parameter.
Set up#
# @title Install AlphaGenome

# @markdown Run this cell to install AlphaGenome.
from IPython.display import clear_output
! pip install alphagenome
clear_output()
Store your API key in Colab Secrets for persistent access across sessions (see Installation).
from alphagenome import colab_utils
from alphagenome.data import gene_annotation, gene_expression_data, genome, track_data, transcript
from alphagenome.models.v2 import dna_client
from alphagenome.visualization import plot_components
import matplotlib.pyplot as plt
import numpy as np
import pandas as pd
Load model and auxiliary objects#
dna_model = dna_client.create(colab_utils.get_api_key())
# Load observed metadata objects for human.
output_metadata = dna_model.observed_metadata(
    organism=dna_client.Organism.HOMO_SAPIENS
)
# Load gene annotations (from GENCODE).
gtf = pd.read_feather(
    'https://storage.googleapis.com/alphagenome/reference/gencode/'
    'hg38/gencode.v46.annotation.gtf.gz.feather'
)

# Filter to protein-coding genes and highly supported transcripts.
gtf_transcript = gene_annotation.filter_transcript_support_level(
    gene_annotation.filter_protein_coding(gtf), ['1']
)

# Extractor for identifying transcripts in a region.
transcript_extractor = transcript.TranscriptExtractor(gtf_transcript)

# Also define an extractor that fetches only the longest transcript per gene.
gtf_longest_transcript = gene_annotation.filter_to_longest_transcript(
    gtf_transcript
)
longest_transcript_extractor = transcript.TranscriptExtractor(
    gtf_longest_transcript
)
RNA-seq and CAGE coverage#
RNA_SEQ and CAGE are coverage tracks that measure gene expression signal.
We predict RNA_SEQ and CAGE in sigmoid colon tissue for a genomic interval
containing APOL4. Positions of the longest transcript per gene in this
interval are shown at the top:
# Define interval to make predictions for (used throughout this tutorial).
# Note that the interval width must be one of the supported sequence lengths.
interval = genome.Interval('chr22', 36_150_498, 36_252_898).resize(
    dna_client.SEQUENCE_LENGTH_1MB
)

# Define the tissue/cell-type to predict expression for.
condition = 'UBERON:0001159'  # Colon - Sigmoid

# Make predictions.
output = dna_model.predict_interval(
    interval=interval,
    requested_outputs={
        dna_client.OutputType.RNA_SEQ,
        dna_client.OutputType.CAGE,
    },
    condition=condition,
)
# Extract the longest transcripts per gene for this interval.
longest_transcripts = longest_transcript_extractor.extract(interval)
Pass a list of panels to plot_components.plot:
# Build plot.
plot = plot_components.plot(
    [
        plot_components.TranscriptAnnotation(longest_transcripts),
        plot_components.Tracks(
            tdata=output.rna_seq,
            ylabel_template='RNA_SEQ: {biosample_name} ({strand})\n{name}',
        ),
        plot_components.Tracks(
            tdata=output.cage,
            ylabel_template='CAGE: {biosample_name} ({strand})\n{name}',
        ),
    ],
    interval=interval,
    title='Predicted RNA Expression (RNA_SEQ, CAGE) for colon tissue',
)
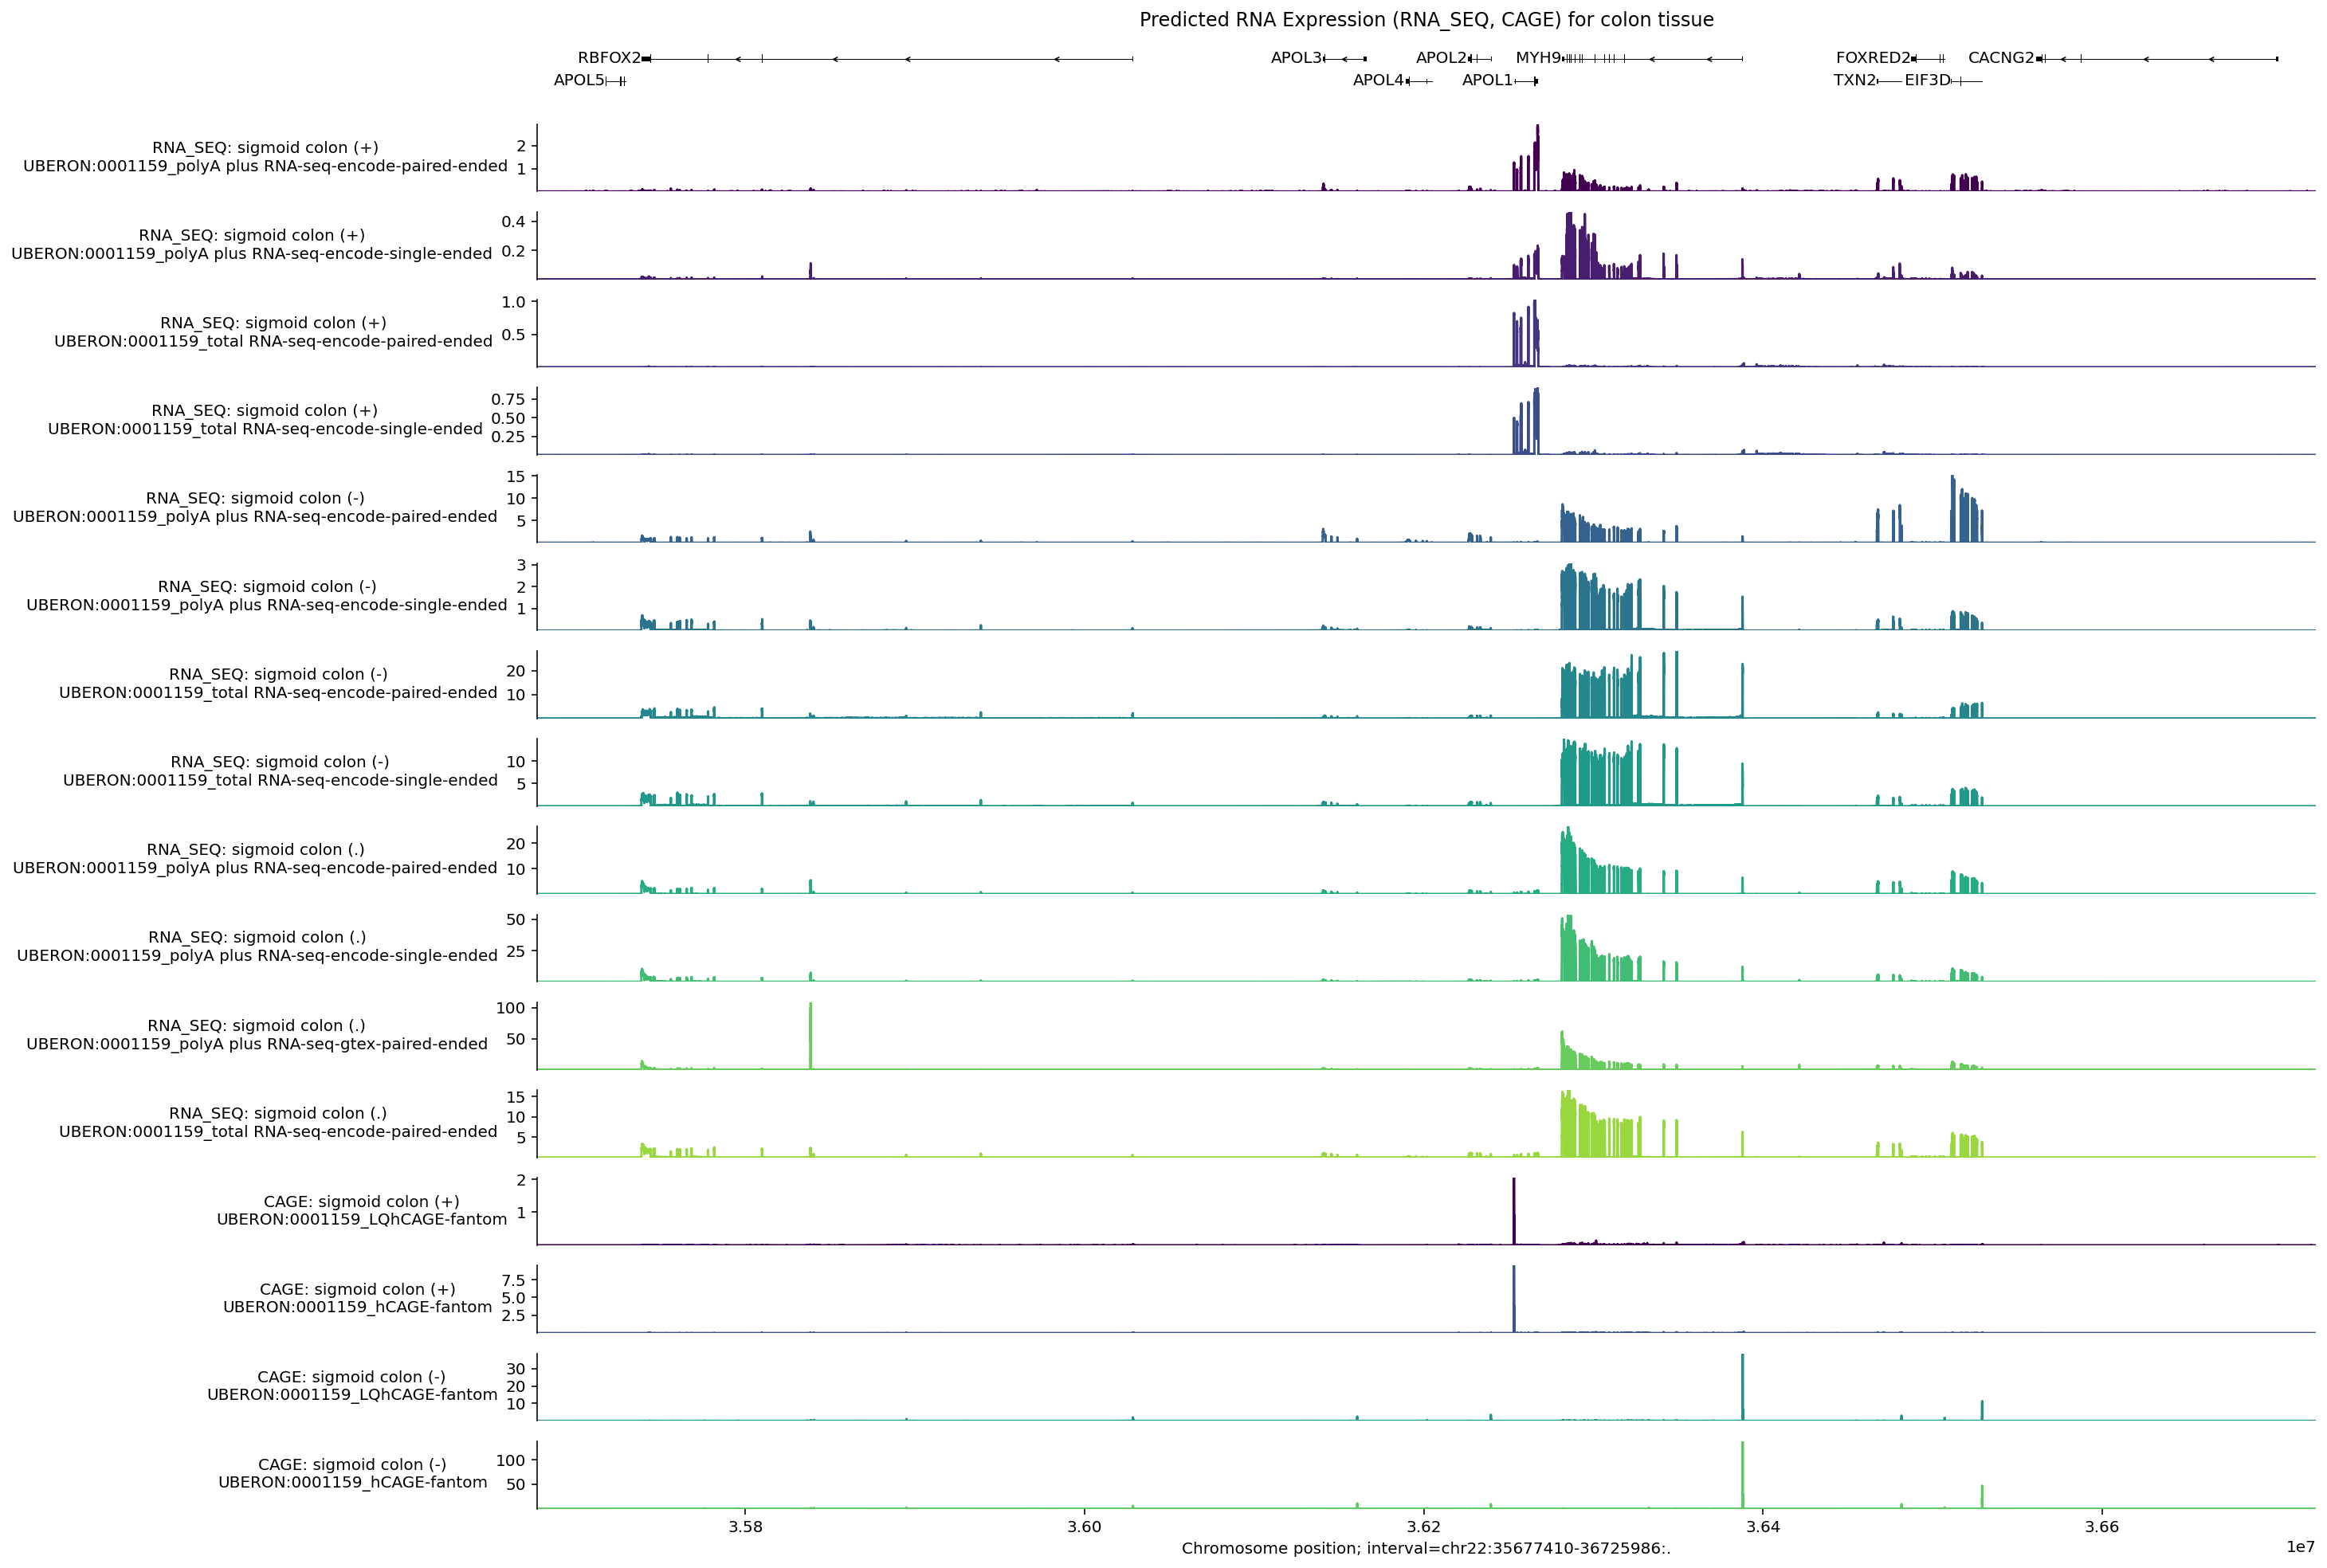
Note that the positive and negative stranded tracks have clearly different signals. Let’s check which genes are transcribed from the positive strand:
[t.info['gene_name'] for t in longest_transcripts if t.strand == '+']
['APOL5', 'APOL1']
For both positive-strand RNA_SEQ tracks, RNA-seq coverage is highest across
APOL1. Similarly for CAGE, positive-strand peaks fall near the start of
APOL1, whereas APOL5 shows no peaks because it is not expressed in colon
tissue (GTEx).
Zoom in and customize track labels#
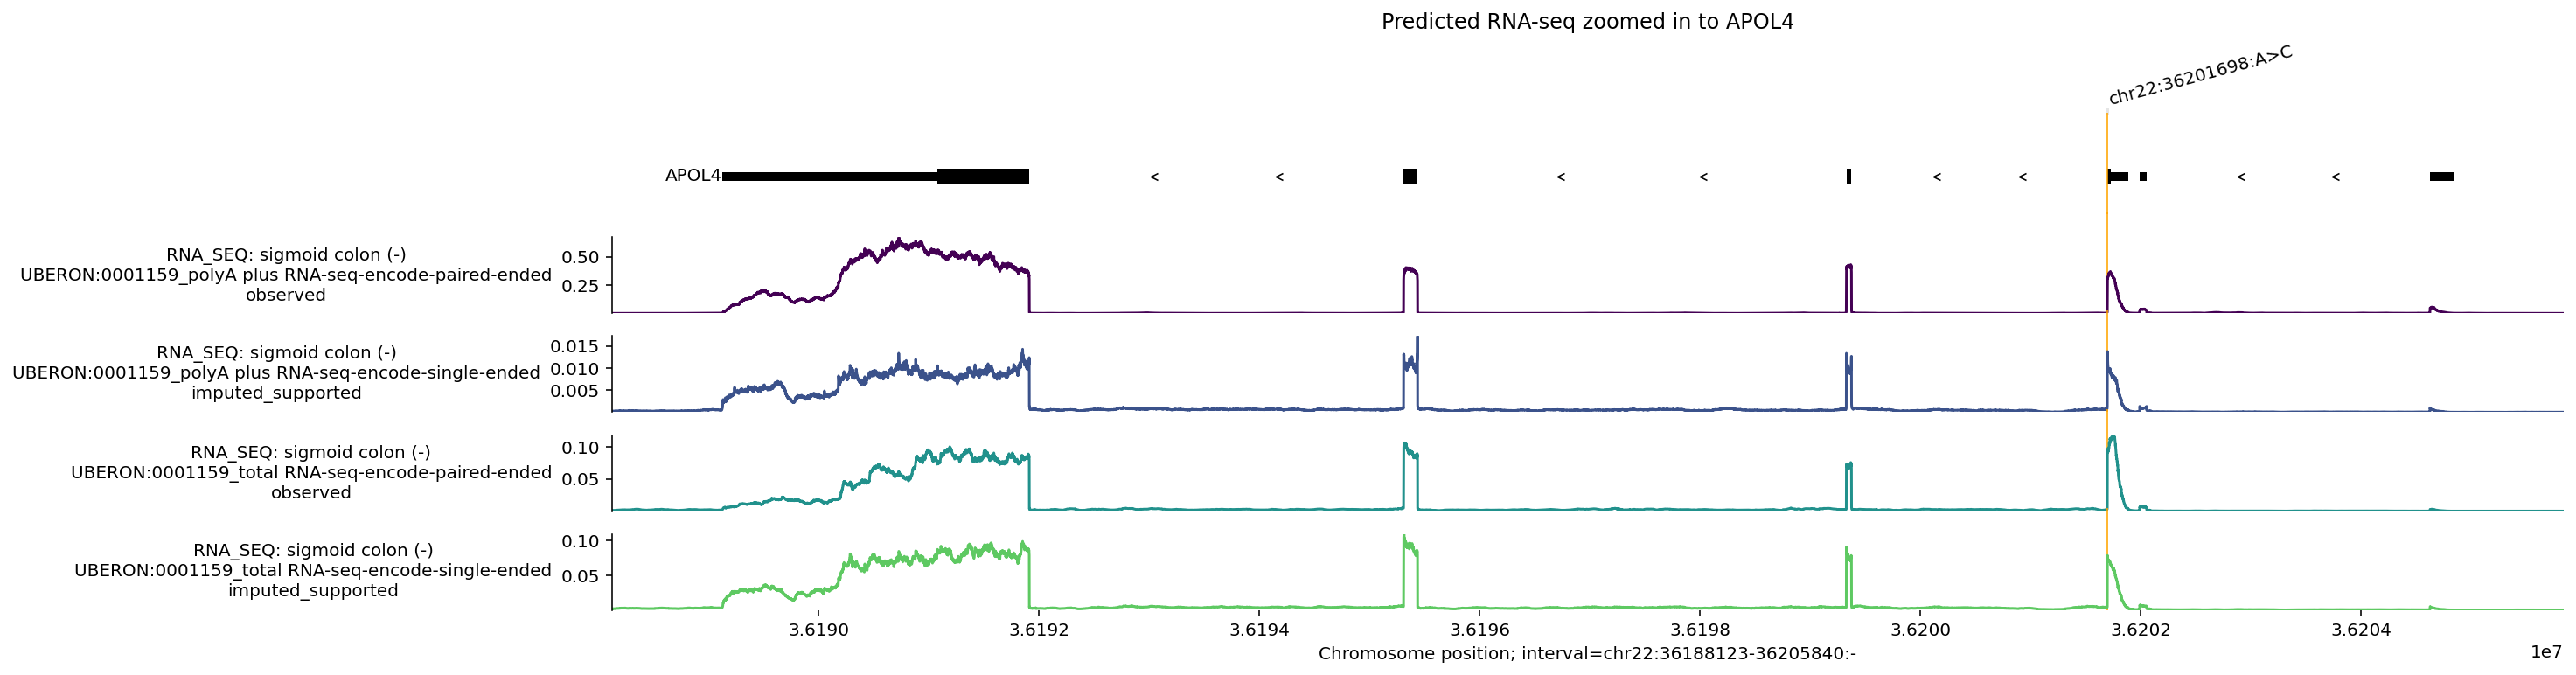
The model predicts across the full 1 Mb input window, while interval= in
plot_components.plot controls the plotted window. Including
{imputation_mode} in ylabel_template indicates whether each track was
directly measured (observed) or imputed in the target condition:
apol4_interval = gene_annotation.get_gene_interval(gtf, gene_symbol='APOL4')
apol4_interval = apol4_interval.resize(apol4_interval.width + 2000)
transcripts = transcript_extractor.extract(interval)

variant = genome.Variant.from_str('chr22_36201698_A_C', genome.VariantFormat.GTEX)

fig = plot_components.plot(
    [
        plot_components.TranscriptAnnotation(longest_transcripts),
        plot_components.Tracks(
            tdata=output.rna_seq.filter_to_negative_strand(),
            ylabel_template=(
                'RNA_SEQ: {biosample_name} ({strand})\n{name}\n{imputation_mode}'
            ),
        ),
    ],
    interval=apol4_interval,
    annotations=[plot_components.VariantAnnotation([variant])],
    title='Predicted RNA-seq zoomed in to APOL4',
)
plt.show()
Plot custom annotation (e.g., polyadenylation sites)#
# Run predictions with an additional ontology to highlight differences across
# tissues.
conditions = [
    'UBERON:0001159',  # Colon - Sigmoid.
    'UBERON:0002048',  # lung.
]

# Make predictions.
outputs = [
    dna_model.predict_interval(
        interval=interval,
        requested_outputs={
            dna_client.OutputType.RNA_SEQ,
        },
        condition=condition,
    )
    for condition in conditions
]
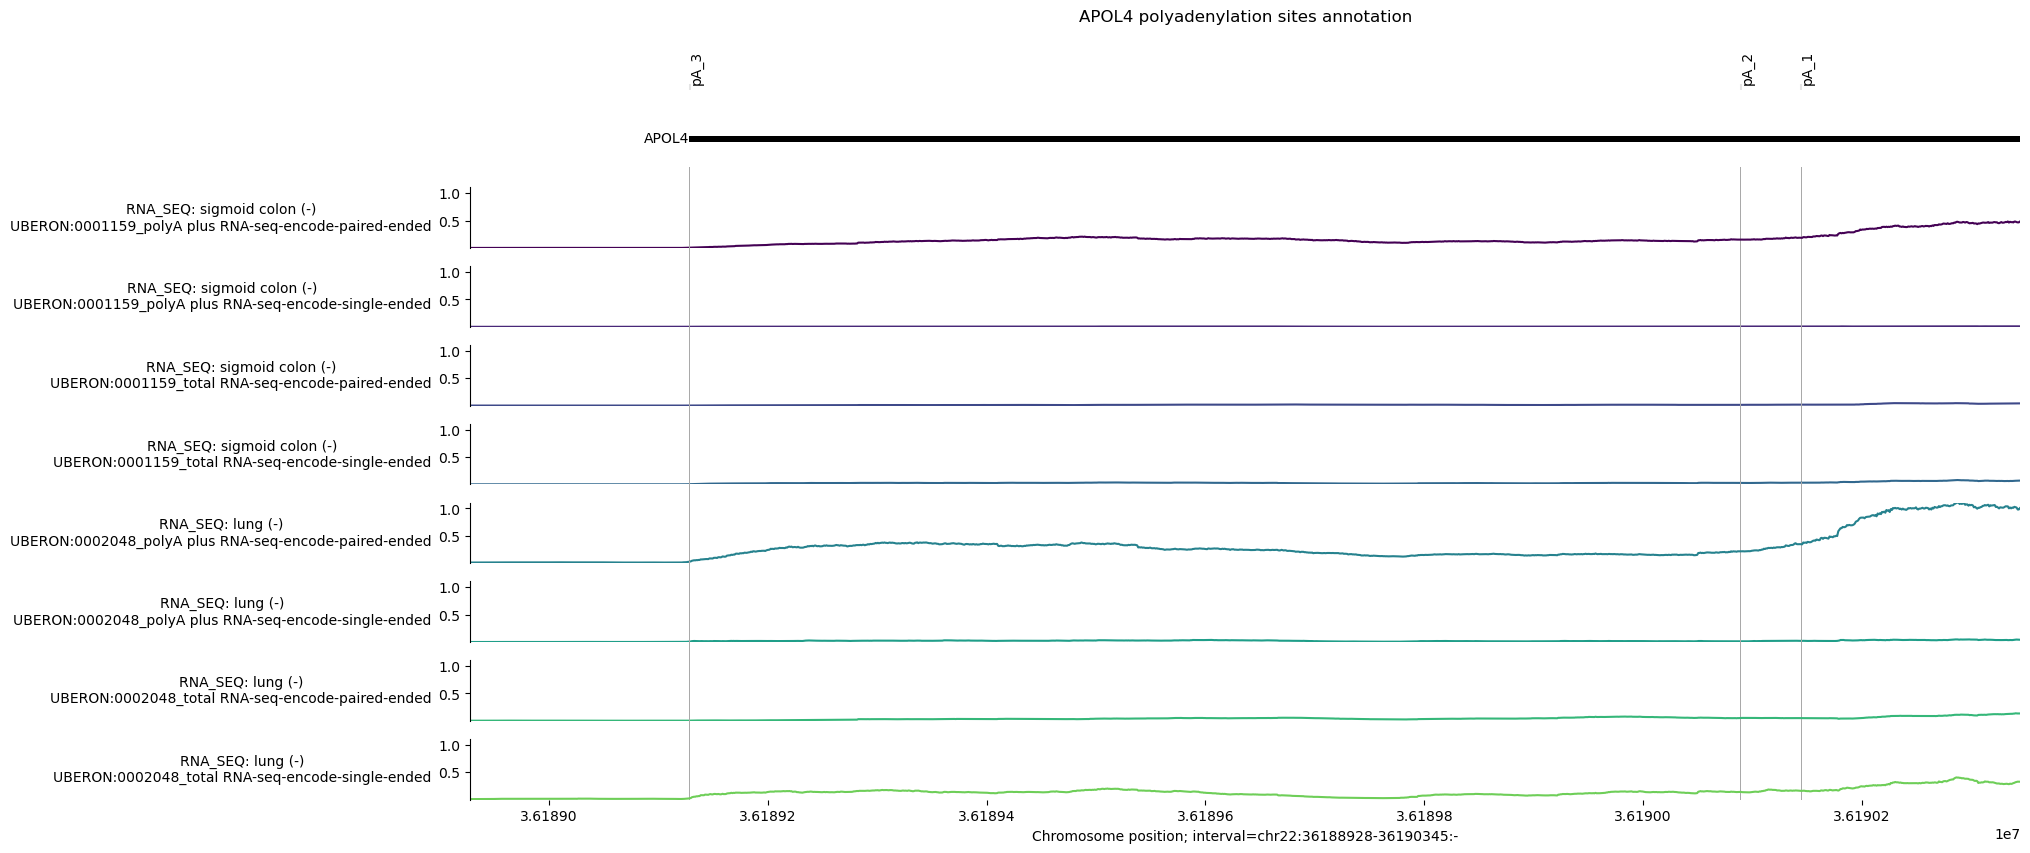
There are 3 annotated polyadenylation (pA) sites overlapping APOL4 transcripts from PolyADBv3 (Wang et al. 2018). We define these positions as 1 bp intervals in hg38 coordinates:
# Define pA sites in hg38 coordinates.
apol4_pAs = [
    genome.Interval('chr22', 36_189_128, 36_189_129, '-'),
    genome.Interval('chr22', 36_190_089, 36_190_090, '-'),
    genome.Interval('chr22', 36_190_144, 36_190_145, '-'),
]

# Define plotting interval as first/last pA plus some offset distance.

offset = 200
pA_interval = genome.Interval(
    'chr22', 36_189_128 - offset, 36_190_145 + offset, '-'
)

# Define intervals annotation.
pA_labels = ['pA_3', 'pA_2', 'pA_1']
# Build plot.
# NOTE: Depending on annotation distance and interval zoom, some annotations may
# appear as overlapping.

plot = plot_components.plot(
    [
        plot_components.TranscriptAnnotation(longest_transcripts),
        # RNA-seq tracks.
        plot_components.Tracks(
            tdata=track_data.concat([
                output.rna_seq.filter_to_negative_strand() for output in outputs
            ]),
            ylabel_template='RNA_SEQ: {biosample_name} ({strand})\n{name}',
            shared_y_scale=True,
        ),
    ],
    annotations=[
        plot_components.IntervalAnnotation(
            apol4_pAs, alpha=1, labels=pA_labels, label_angle=90
        )
    ],
    interval=pA_interval,
    title='APOL4 polyadenylation sites annotation',
)
Single-cell gene expression#
For single-cell data, AlphaGenome 2 outputs a predicted expression value per gene rather than a base-resolution coverage track.
To show gene-level values alongside coverage tracks, GeneExpression draws each
gene’s predicted value as a horizontal segment over the gene body labeled in
counts per million (CPM). Here we compare placental epithelial cells, which
express APOL4, with placental T cells:
conditions = [
    'UBERON:0001987_CL:0000066',  # Placenta Epithelial Cell
    'UBERON:0001987_CL:0000084',  # Placenta T-cell
]
output = [
    dna_model.predict_interval(
        interval=interval,
        requested_outputs={
            dna_client.OutputType.SC_GENE_EXPRESSION,
        },
        condition=condition,
    )
    for condition in conditions
]
For SC_GENE_EXPRESSION, predictions are returned as GeneExpressionData objects
containing a gene-by-track values matrix alongside gene_metadata and
track_metadata tables. Convenience methods (filter_to_protein_coding(),
filter_to_observed(), filter_to_negative_strand()) or boolean masks filter
to genes and tracks of interest.
As with track_data.concat for TrackData, use gene_expression_data.concat
to combine predictions from multiple conditions:
# Concatenate predictions for the two queried ontologies
gex_pred = gene_expression_data.concat(
    [out.sc_gene_expression for out in output]
)

# Select only protein-coding genes and observed, negative strand tracks.
gex_pred = (
    gex_pred.filter_to_protein_coding()
    .filter_to_observed()
    .filter_to_negative_strand()
)
We can now use the GeneExpression component to plot the predicted gene
expression values.
Tip
To hide printed CPM labels on each gene bar, pass show_value=False. Setting
log_scale=True displays expression on a log1p scale so highly expressed neighbor
genes do not compress moderate-expression genes near zero.
plot_components.plot(
    [
        plot_components.TranscriptAnnotation(longest_transcripts),
        plot_components.GeneExpression(
            gdata=gex_pred,
            ylabel_template='{biosample_name} {strand}',
            cmap='RdBu',
            log_scale=True,
            shared_y_scale=True,
        ),
    ],
    interval=interval.resize(100_000),  # We zoom in on APOL4
)
plt.show()

As expected, we observe higher expression of APOL4 in placental epithelial cells than in T cells, and the opposite pattern for APOL3.
Chromatin accessibility#
Chromatin accessibility is captured by the DNASE, ATAC, and SC_ATAC output
types. We show ATAC and DNASE here (SC_ATAC can be requested the same
way), plotting predictions across intestinal tract reference conditions for the
interval around APOL4:
# List of IDs corresponding to various intestinal tissues.
conditions = [
    'UBERON:0000317',
    'UBERON:0001155',
    'UBERON:0001157',
    'UBERON:0001159',
    'UBERON:0004992',
    'UBERON:0008971',
]
# Make predictions.
outputs = [
    dna_model.predict_interval(
        interval,
        requested_outputs={
            dna_client.OutputType.DNASE,
            dna_client.OutputType.ATAC,
        },
        condition=condition,
    )
    for condition in conditions
]
Use plot_components.IntervalAnnotation to mark two putative promoters from the
Ensembl Regulatory Build and check whether they overlap predicted accessible
regions:
# Two putative promoter intervals from Ensembl.
promoter_intervals = [
    genome.Interval(
        'chr22', 36_201_799, 36_202_681, name='Ensembl_promoter:ENSR00001367790'
    ),
    genome.Interval(
        'chr22', 36_204_705, 36_205_330, name='Ensembl_promoter:ENSR00001367792'
    ),
]
# Build plot.
plot = plot_components.plot(
    [
        plot_components.TranscriptAnnotation(longest_transcripts),
        plot_components.Tracks(
            tdata=track_data.concat([output.dnase for output in outputs]),
            ylabel_template='DNASE: {biosample_name} ({strand})\n{name}',
        ),
        plot_components.Tracks(
            tdata=track_data.concat([output.atac for output in outputs]),
            ylabel_template='ATAC: {biosample_name} ({strand})\n{name}',
        ),
    ],
    # Plot an 8kb window around the variant.
    interval=variant.reference_interval.resize(8000),
    annotations=[
        plot_components.VariantAnnotation([variant]),
        plot_components.IntervalAnnotation(promoter_intervals),
    ],
    title='Predicted chromatin accessibility (DNASE, ATAC) for colon tissue',
)
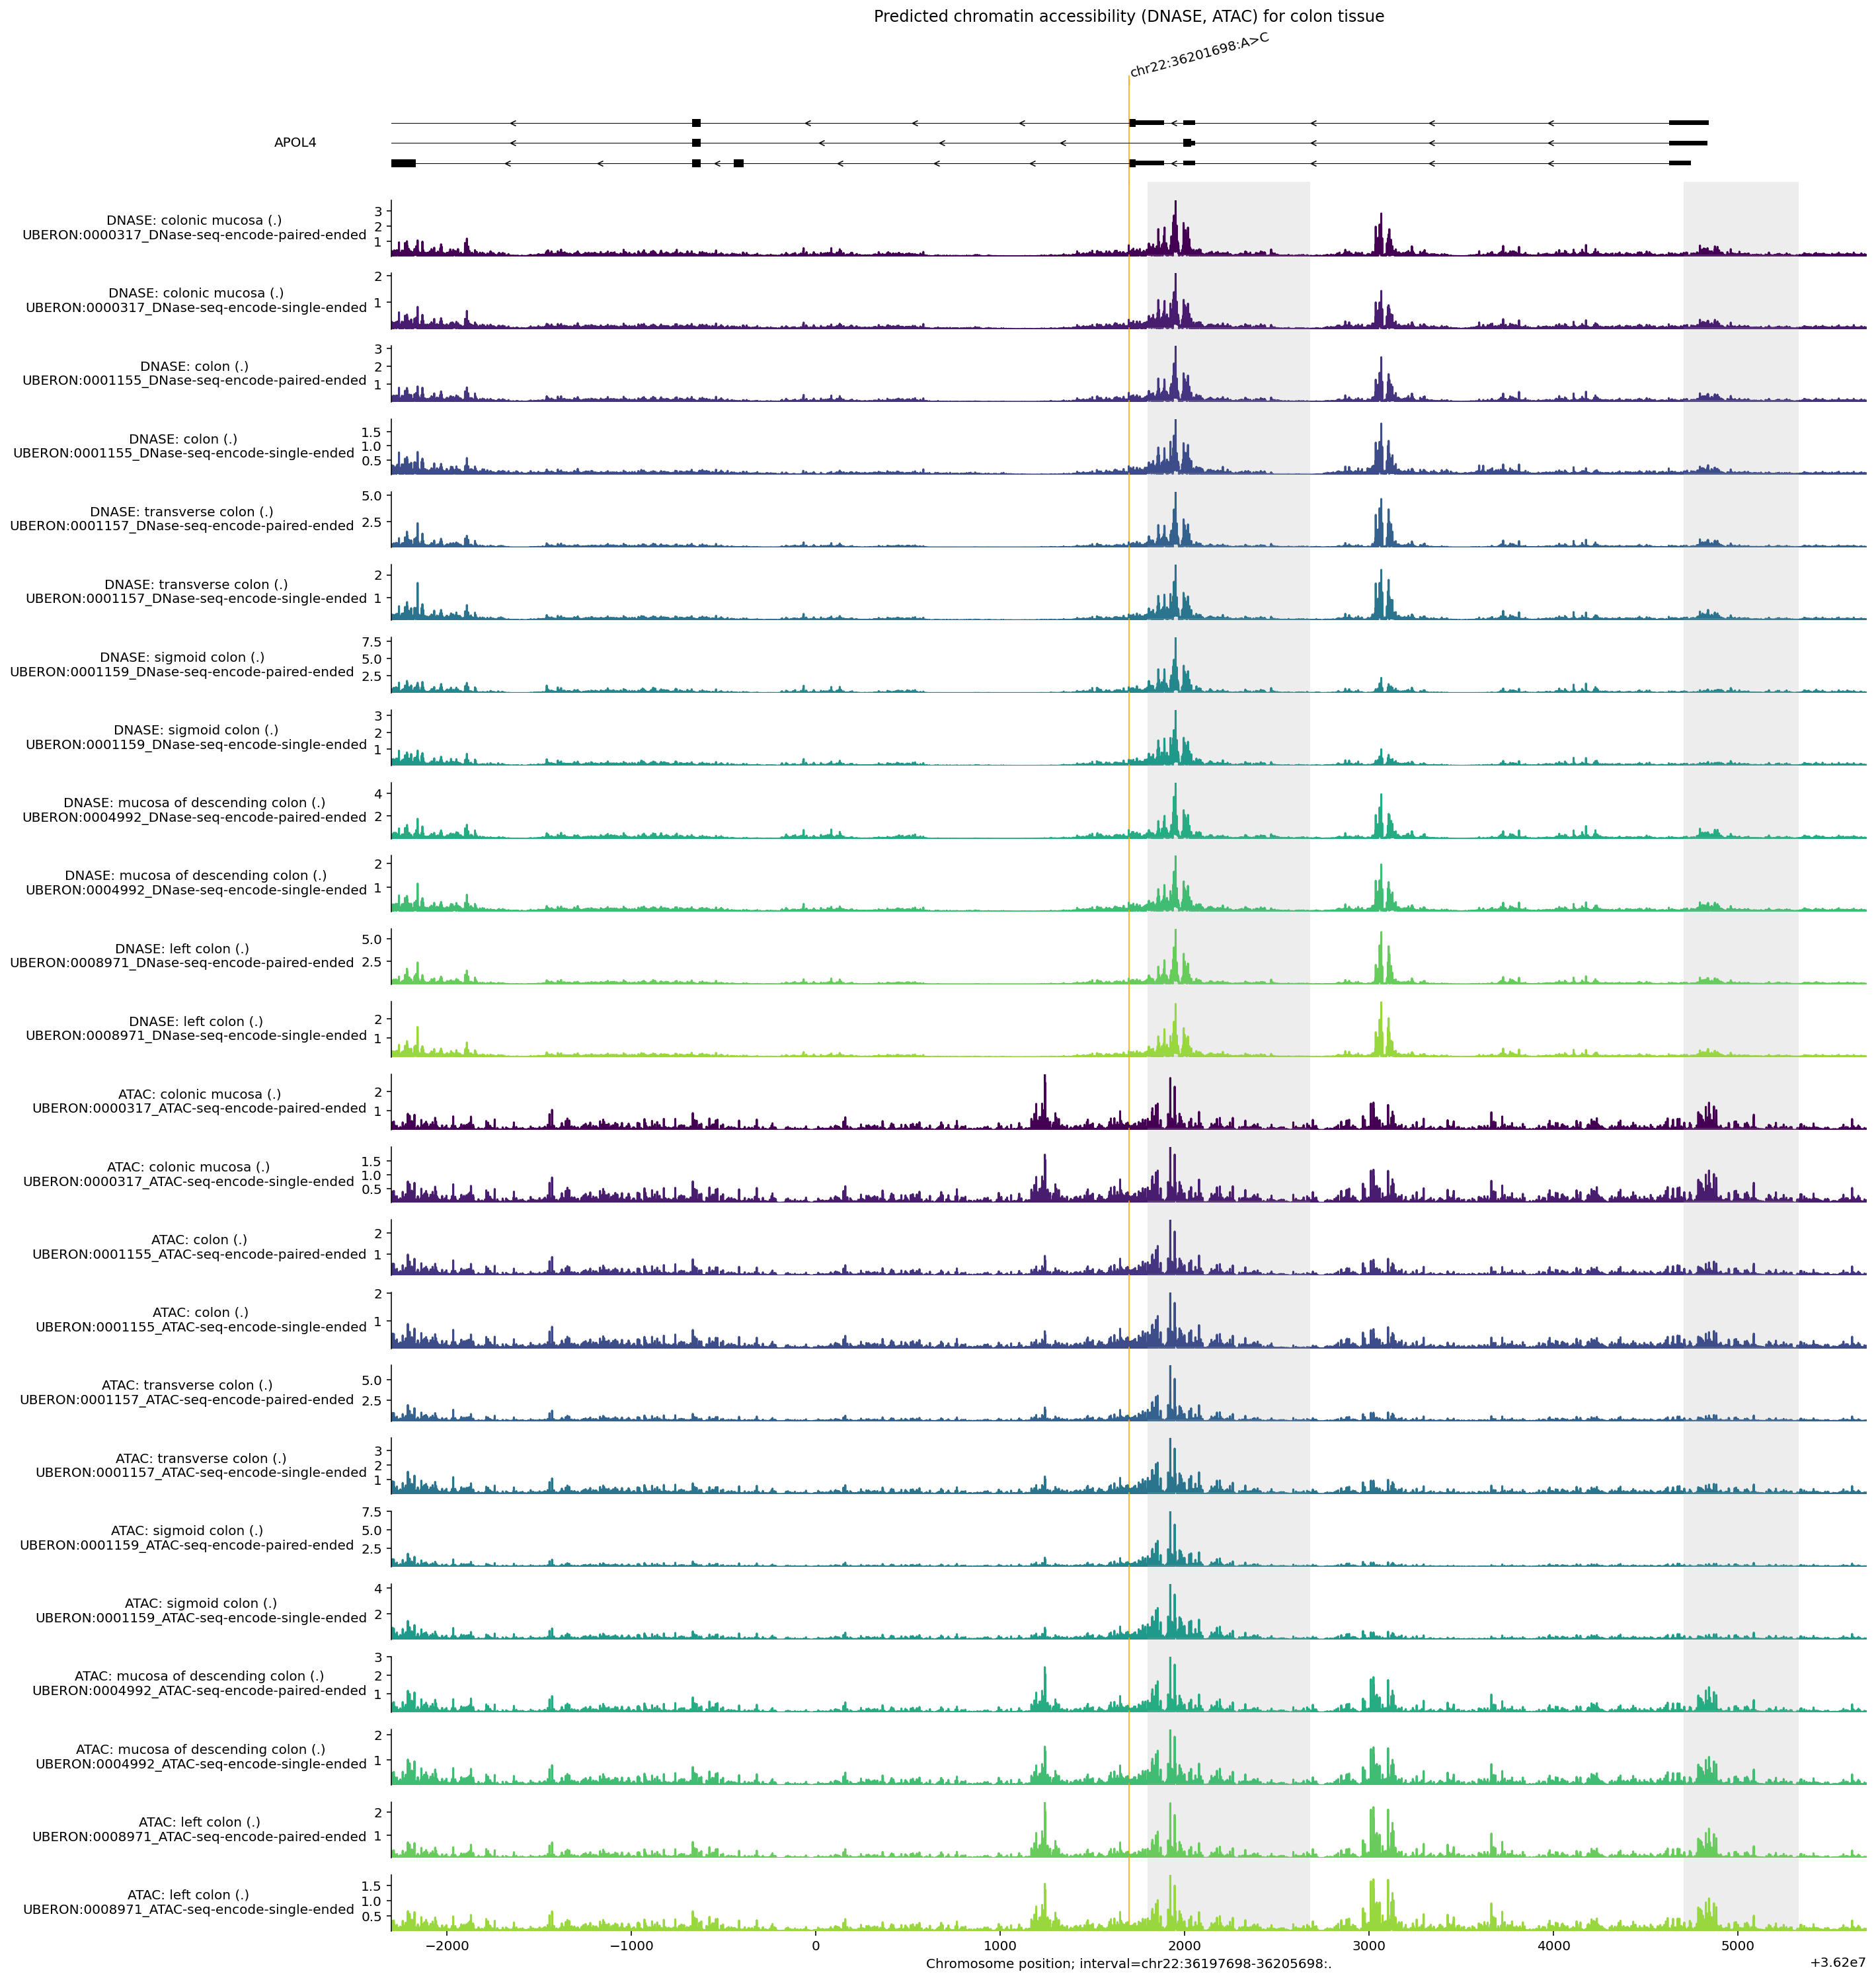
Observations from this plot:
Elevated
DNASEandATACsignals overlap both putative promoter regions highlighted in grey, and additional accessibility peaks mark candidate distal regulatory elements.DNASEandATACsignals are similar but not identical, reflecting differences in assay protocol.Accessibility is low directly at the variant position (orange line).
Histone ChIP-seq#
Histone modification marks are captured by the CHIP_HISTONE output. Here we
visualize predictions across the same interval for colon tissues.
Two properties apply to CHIP_HISTONE (and CHIP_TF) predictions in
AlphaGenome 2:
Predictions are returned at 128 bp resolution, and
plot_componentsaligns plotted intervals to bin boundaries automatically.Every supported condition returns all 43 histone ChIP channels (covering 32 marks split by sequencing endedness). Use
dna_model.observed_metadata(...)ormetadata['imputation_mode']to inspect which histone marks were directly measured (observed) in each tissue:
output_metadata.chip_histone[
    output_metadata.chip_histone['biosample_name'].str.contains('colon')
]
| name | strand | biosample_curie | imputation_mode | biosample_type | biosample_name | Assay title | data_source | histone_mark | genetically_modified | endedness | data_pipeline | |
|---|---|---|---|---|---|---|---|---|---|---|---|---|
| 191 | UBERON:0000317_Histone ChIP-seq-encode-H3K27ac... | . | UBERON:0000317 | observed | tissue | colonic mucosa | Histone ChIP-seq | encode | H3K27ac | False | single | encode |
| 192 | UBERON:0000317_Histone ChIP-seq-encode-H3K27me... | . | UBERON:0000317 | observed | tissue | colonic mucosa | Histone ChIP-seq | encode | H3K27me3 | False | single | encode |
| 193 | UBERON:0000317_Histone ChIP-seq-encode-H3K36me... | . | UBERON:0000317 | observed | tissue | colonic mucosa | Histone ChIP-seq | encode | H3K36me3 | False | single | encode |
| 194 | UBERON:0000317_Histone ChIP-seq-encode-H3K4me1... | . | UBERON:0000317 | observed | tissue | colonic mucosa | Histone ChIP-seq | encode | H3K4me1 | False | single | encode |
| 195 | UBERON:0000317_Histone ChIP-seq-encode-H3K4me3... | . | UBERON:0000317 | observed | tissue | colonic mucosa | Histone ChIP-seq | encode | H3K4me3 | False | single | encode |
| 196 | UBERON:0000317_Histone ChIP-seq-encode-H3K9ac-... | . | UBERON:0000317 | observed | tissue | colonic mucosa | Histone ChIP-seq | encode | H3K9ac | False | single | encode |
| 218 | UBERON:0001157_Histone ChIP-seq-encode-H3K27ac... | . | UBERON:0001157 | observed | tissue | transverse colon | Histone ChIP-seq | encode | H3K27ac | False | single | encode |
| 219 | UBERON:0001157_Histone ChIP-seq-encode-H3K27me... | . | UBERON:0001157 | observed | tissue | transverse colon | Histone ChIP-seq | encode | H3K27me3 | False | single | encode |
| 220 | UBERON:0001157_Histone ChIP-seq-encode-H3K36me... | . | UBERON:0001157 | observed | tissue | transverse colon | Histone ChIP-seq | encode | H3K36me3 | False | single | encode |
| 221 | UBERON:0001157_Histone ChIP-seq-encode-H3K4me1... | . | UBERON:0001157 | observed | tissue | transverse colon | Histone ChIP-seq | encode | H3K4me1 | False | single | encode |
| 222 | UBERON:0001157_Histone ChIP-seq-encode-H3K4me3... | . | UBERON:0001157 | observed | tissue | transverse colon | Histone ChIP-seq | encode | H3K4me3 | False | single | encode |
| 223 | UBERON:0001159_Histone ChIP-seq-encode-H3K27ac... | . | UBERON:0001159 | observed | tissue | sigmoid colon | Histone ChIP-seq | encode | H3K27ac | False | single | encode |
| 224 | UBERON:0001159_Histone ChIP-seq-encode-H3K27me... | . | UBERON:0001159 | observed | tissue | sigmoid colon | Histone ChIP-seq | encode | H3K27me3 | False | single | encode |
| 225 | UBERON:0001159_Histone ChIP-seq-encode-H3K36me... | . | UBERON:0001159 | observed | tissue | sigmoid colon | Histone ChIP-seq | encode | H3K36me3 | False | single | encode |
| 226 | UBERON:0001159_Histone ChIP-seq-encode-H3K4me1... | . | UBERON:0001159 | observed | tissue | sigmoid colon | Histone ChIP-seq | encode | H3K4me1 | False | single | encode |
| 227 | UBERON:0001159_Histone ChIP-seq-encode-H3K4me3... | . | UBERON:0001159 | observed | tissue | sigmoid colon | Histone ChIP-seq | encode | H3K4me3 | False | single | encode |
| 303 | UBERON:0004992_Histone ChIP-seq-encode-H3K4me1... | . | UBERON:0004992 | observed | tissue | mucosa of descending colon | Histone ChIP-seq | encode | H3K4me1 | False | single | encode |
| 304 | UBERON:0004992_Histone ChIP-seq-encode-H3K4me3... | . | UBERON:0004992 | observed | tissue | mucosa of descending colon | Histone ChIP-seq | encode | H3K4me3 | False | single | encode |
| 305 | UBERON:0004992_Histone ChIP-seq-encode-H3K9me3... | . | UBERON:0004992 | observed | tissue | mucosa of descending colon | Histone ChIP-seq | encode | H3K9me3 | False | single | encode |
| 1174 | UBERON:0012489_Histone ChIP-seq-encode-H3K27ac... | . | UBERON:0012489 | observed | tissue | muscle layer of colon | Histone ChIP-seq | encode | H3K27ac | False | single | encode |
| 1175 | UBERON:0012489_Histone ChIP-seq-encode-H3K36me... | . | UBERON:0012489 | observed | tissue | muscle layer of colon | Histone ChIP-seq | encode | H3K36me3 | False | single | encode |
| 1176 | UBERON:0012489_Histone ChIP-seq-encode-H3K4me1... | . | UBERON:0012489 | observed | tissue | muscle layer of colon | Histone ChIP-seq | encode | H3K4me1 | False | single | encode |
| 1177 | UBERON:0012489_Histone ChIP-seq-encode-H3K4me3... | . | UBERON:0012489 | observed | tissue | muscle layer of colon | Histone ChIP-seq | encode | H3K4me3 | False | single | encode |
| 1178 | UBERON:0012489_Histone ChIP-seq-encode-H3K9ac-... | . | UBERON:0012489 | observed | tissue | muscle layer of colon | Histone ChIP-seq | encode | H3K9ac | False | single | encode |
# List of IDs corresponding to various colon tissues in `CHIP_HISTONE` output.
conditions = [
    'UBERON:0000317',
    'UBERON:0001155',
    'UBERON:0001157',
    'UBERON:0001159',
]

# Make predictions.
outputs = [
    dna_model.predict_interval(
        interval=interval,
        requested_outputs={dna_client.OutputType.CHIP_HISTONE},
        condition=condition,
    )
    for condition in conditions
]
We can extract the locations of transcription start sites as annotated by
GENCODE using gene_annotation.extract_tss(), and plot these using
plot_components.IntervalAnnotation():
gtf_tss = gene_annotation.extract_tss(gtf_longest_transcript)

tss_as_intervals = [
    genome.Interval(
        chromosome=row.Chromosome,
        start=row.Start,
        end=row.End + 1000,  # Add extra 1Kb so the TSSs are visible.
        name=row.gene_name,
    )
    for _, row in gtf_tss.iterrows()
]
We can also reorder tracks so they are grouped by histone mark, and also specify colors based on their histone mark:
concatenated_outputs = track_data.concat(
    [output.chip_histone for output in outputs]
)
reordered_chip_histone = concatenated_outputs.select_tracks_by_index(
    concatenated_outputs.metadata.sort_values('histone_mark').index
)

histone_to_color = {
    'H3K27AC': '#e41a1c',
    'H3K36ME3': '#ff7f00',
    'H3K4ME1': '#377eb8',
    'H3K4ME3': '#984ea3',
    'H3K9AC': '#4daf4a',
    'H3K27ME3': '#ffc0cb',
}
track_colors = (
    reordered_chip_histone.metadata['histone_mark']
    .map(lambda x: histone_to_color.get(x.upper(), '#000000'))
    .values
)
# Build plot.
observed_tracks_mask = (
    reordered_chip_histone.metadata['imputation_mode'] == 'observed'
).values
plot = plot_components.plot(
    [
        plot_components.TranscriptAnnotation(longest_transcripts),
        plot_components.Tracks(
            tdata=reordered_chip_histone.filter_tracks(observed_tracks_mask),
            ylabel_template=(
                'CHIP HISTONE: {biosample_name} ({strand})\n{histone_mark}'
            ),
            filled=True,
            track_colors=track_colors[observed_tracks_mask],
        ),
    ],
    interval=interval,
    annotations=[
        plot_components.IntervalAnnotation(
            tss_as_intervals, alpha=0.5, colors='blue'
        )
    ],
    despine_keep_bottom=True,
    title='Predicted histone modification markers in colon tissue',
)
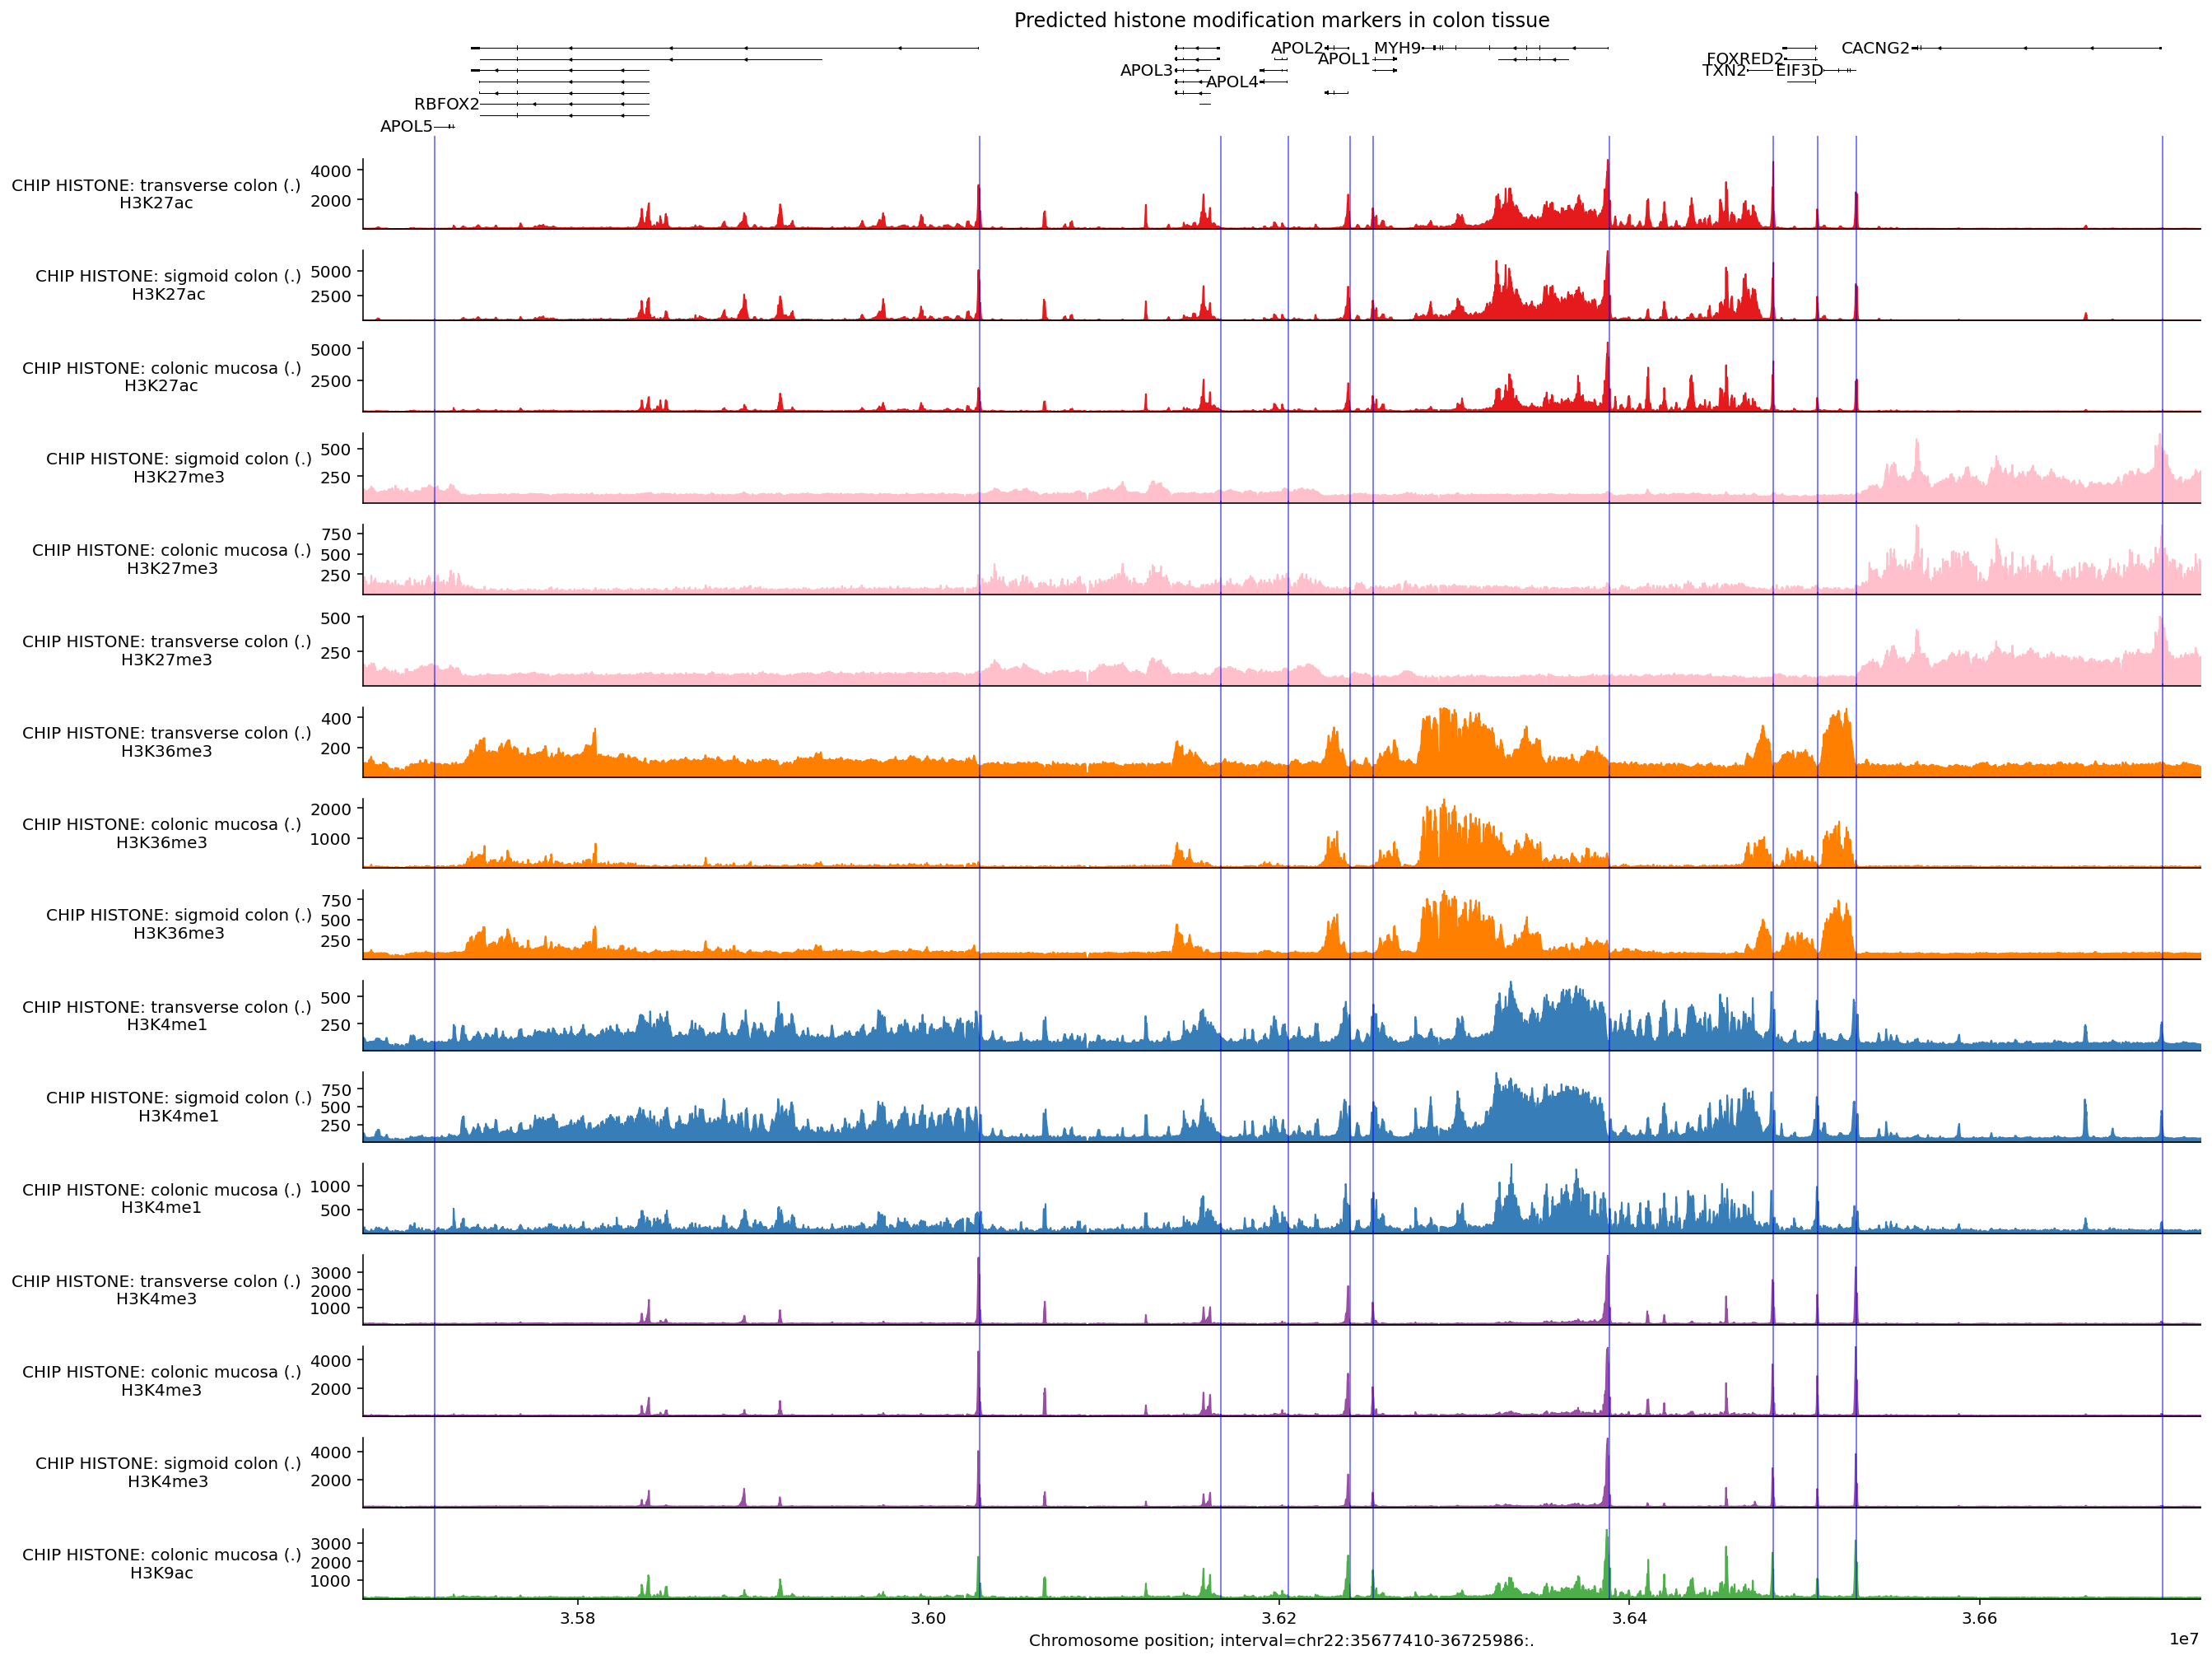
We can see that many of the predicted histone modification peaks overlap with transcription start sites, especially markers associated with promoters (H3K4me3, H3K27ac, and H3K9ac). Other markers such as H3K36me3 and H3K4me1 are more associated with gene bodies and enhancers, so these signals are less pronounced around the TSSs.
TF ChIP-seq#
Transcription factor (TF) binding patterns are captured by the CHIP_TF output
at 128 bp resolution. Every supported condition returns all 911 TF ChIP channels (covering 778 targets split by sequencing endedness); dna_model.observed_metadata(...) identifies which factors were directly assayed in each biosample (for example, HepG2 and K562 have observed TF ChIP-seq coverage across hundreds of factors).
Here we also demonstrate selecting specific tracks from a TrackData object and
aggregating signal across tracks:
conditions = [
    'UBERON:0001159',  # Sigmoid colon.
    'UBERON:0001157',  # Transverse colon.
    'EFO:0002067',  # K562.
    'EFO:0001187',  # HepG2.
]

outputs = [
    dna_model.predict_interval(
        interval=interval,
        requested_outputs={dna_client.OutputType.CHIP_TF},
        condition=condition,
    )
    for condition in conditions
]

concatenated_chip_tf = track_data.concat([output.chip_tf for output in outputs])
Say we then only want to work with the K562 and HepG2 part of the output. We can
accomplish this by calling filter_tracks:
conditions = [
    'EFO:0002067',  # K562.
    'EFO:0001187',  # HepG2.
]

output_chip_tf = concatenated_chip_tf.filter_tracks(
    (concatenated_chip_tf.metadata['biosample_curie'].isin(conditions)).values
)
len(output_chip_tf.metadata)
1822
Across the predicted TF ChIP-seq tracks for these two cell lines, maximum predicted values vary substantially across factors:
max_predictions = output_chip_tf.metadata[
    ['biosample_curie', 'biosample_name', 'transcription_factor']
].copy()

max_predictions.loc[:, 'max_prediction'] = output_chip_tf.values.max(axis=0)
max_predictions.sort_values('max_prediction', ascending=False).reset_index(
    drop=True
)
| biosample_curie | biosample_name | transcription_factor | max_prediction | |
|---|---|---|---|---|
| 0 | EFO:0002067 | K562 | E2F6 | 43330.480469 |
| 1 | EFO:0002067 | K562 | MAX | 34710.921875 |
| 2 | EFO:0002067 | K562 | REST | 33534.230469 |
| 3 | EFO:0002067 | K562 | PKNOX1 | 33243.894531 |
| 4 | EFO:0001187 | HepG2 | REST | 32402.304688 |
| ... | ... | ... | ... | ... |
| 1817 | EFO:0002067 | K562 | GPBP1L1 | 158.165741 |
| 1818 | EFO:0002067 | K562 | BCLAF1 | 152.707596 |
| 1819 | EFO:0001187 | HepG2 | NR0B1 | 152.435913 |
| 1820 | EFO:0001187 | HepG2 | COPS2 | 151.663513 |
| 1821 | EFO:0002067 | K562 | COPS2 | 145.587006 |
1822 rows × 4 columns
To keep the multi-track plot legible across 1 Mb, we select only tracks whose
maximum predicted peak amplitude exceeds 10_000, which isolates the handful of
highest-signal factors in this window:
print(f'Number of tracks before filtering: {len(output_chip_tf.metadata)}')

output_filtered = output_chip_tf.filter_tracks(
    output_chip_tf.values.max(axis=0) > 10_000
)
print(f'Number of tracks after filtering: {len(output_filtered.metadata)}')
Number of tracks before filtering: 1822
Number of tracks after filtering: 23
This is a more manageable number of tracks to visualize. Let’s build up the plot as before:
# Build plot.
plot_components.plot(
    components=[
        plot_components.TranscriptAnnotation(longest_transcripts),
        plot_components.Tracks(
            tdata=output_filtered,
            ylabel_template=(
                'CHIP TF: {biosample_name} ({strand})\n{transcription_factor}'
            ),
            filled=True,
        ),
    ],
    interval=interval,
    title='Predicted TF-binding in K562 and HepG2 cell-lines.',
    despine_keep_bottom=True,
    annotations=[
        plot_components.IntervalAnnotation(
            tss_as_intervals, alpha=0.3, colors='blue'
        )
    ],
)
plt.show()
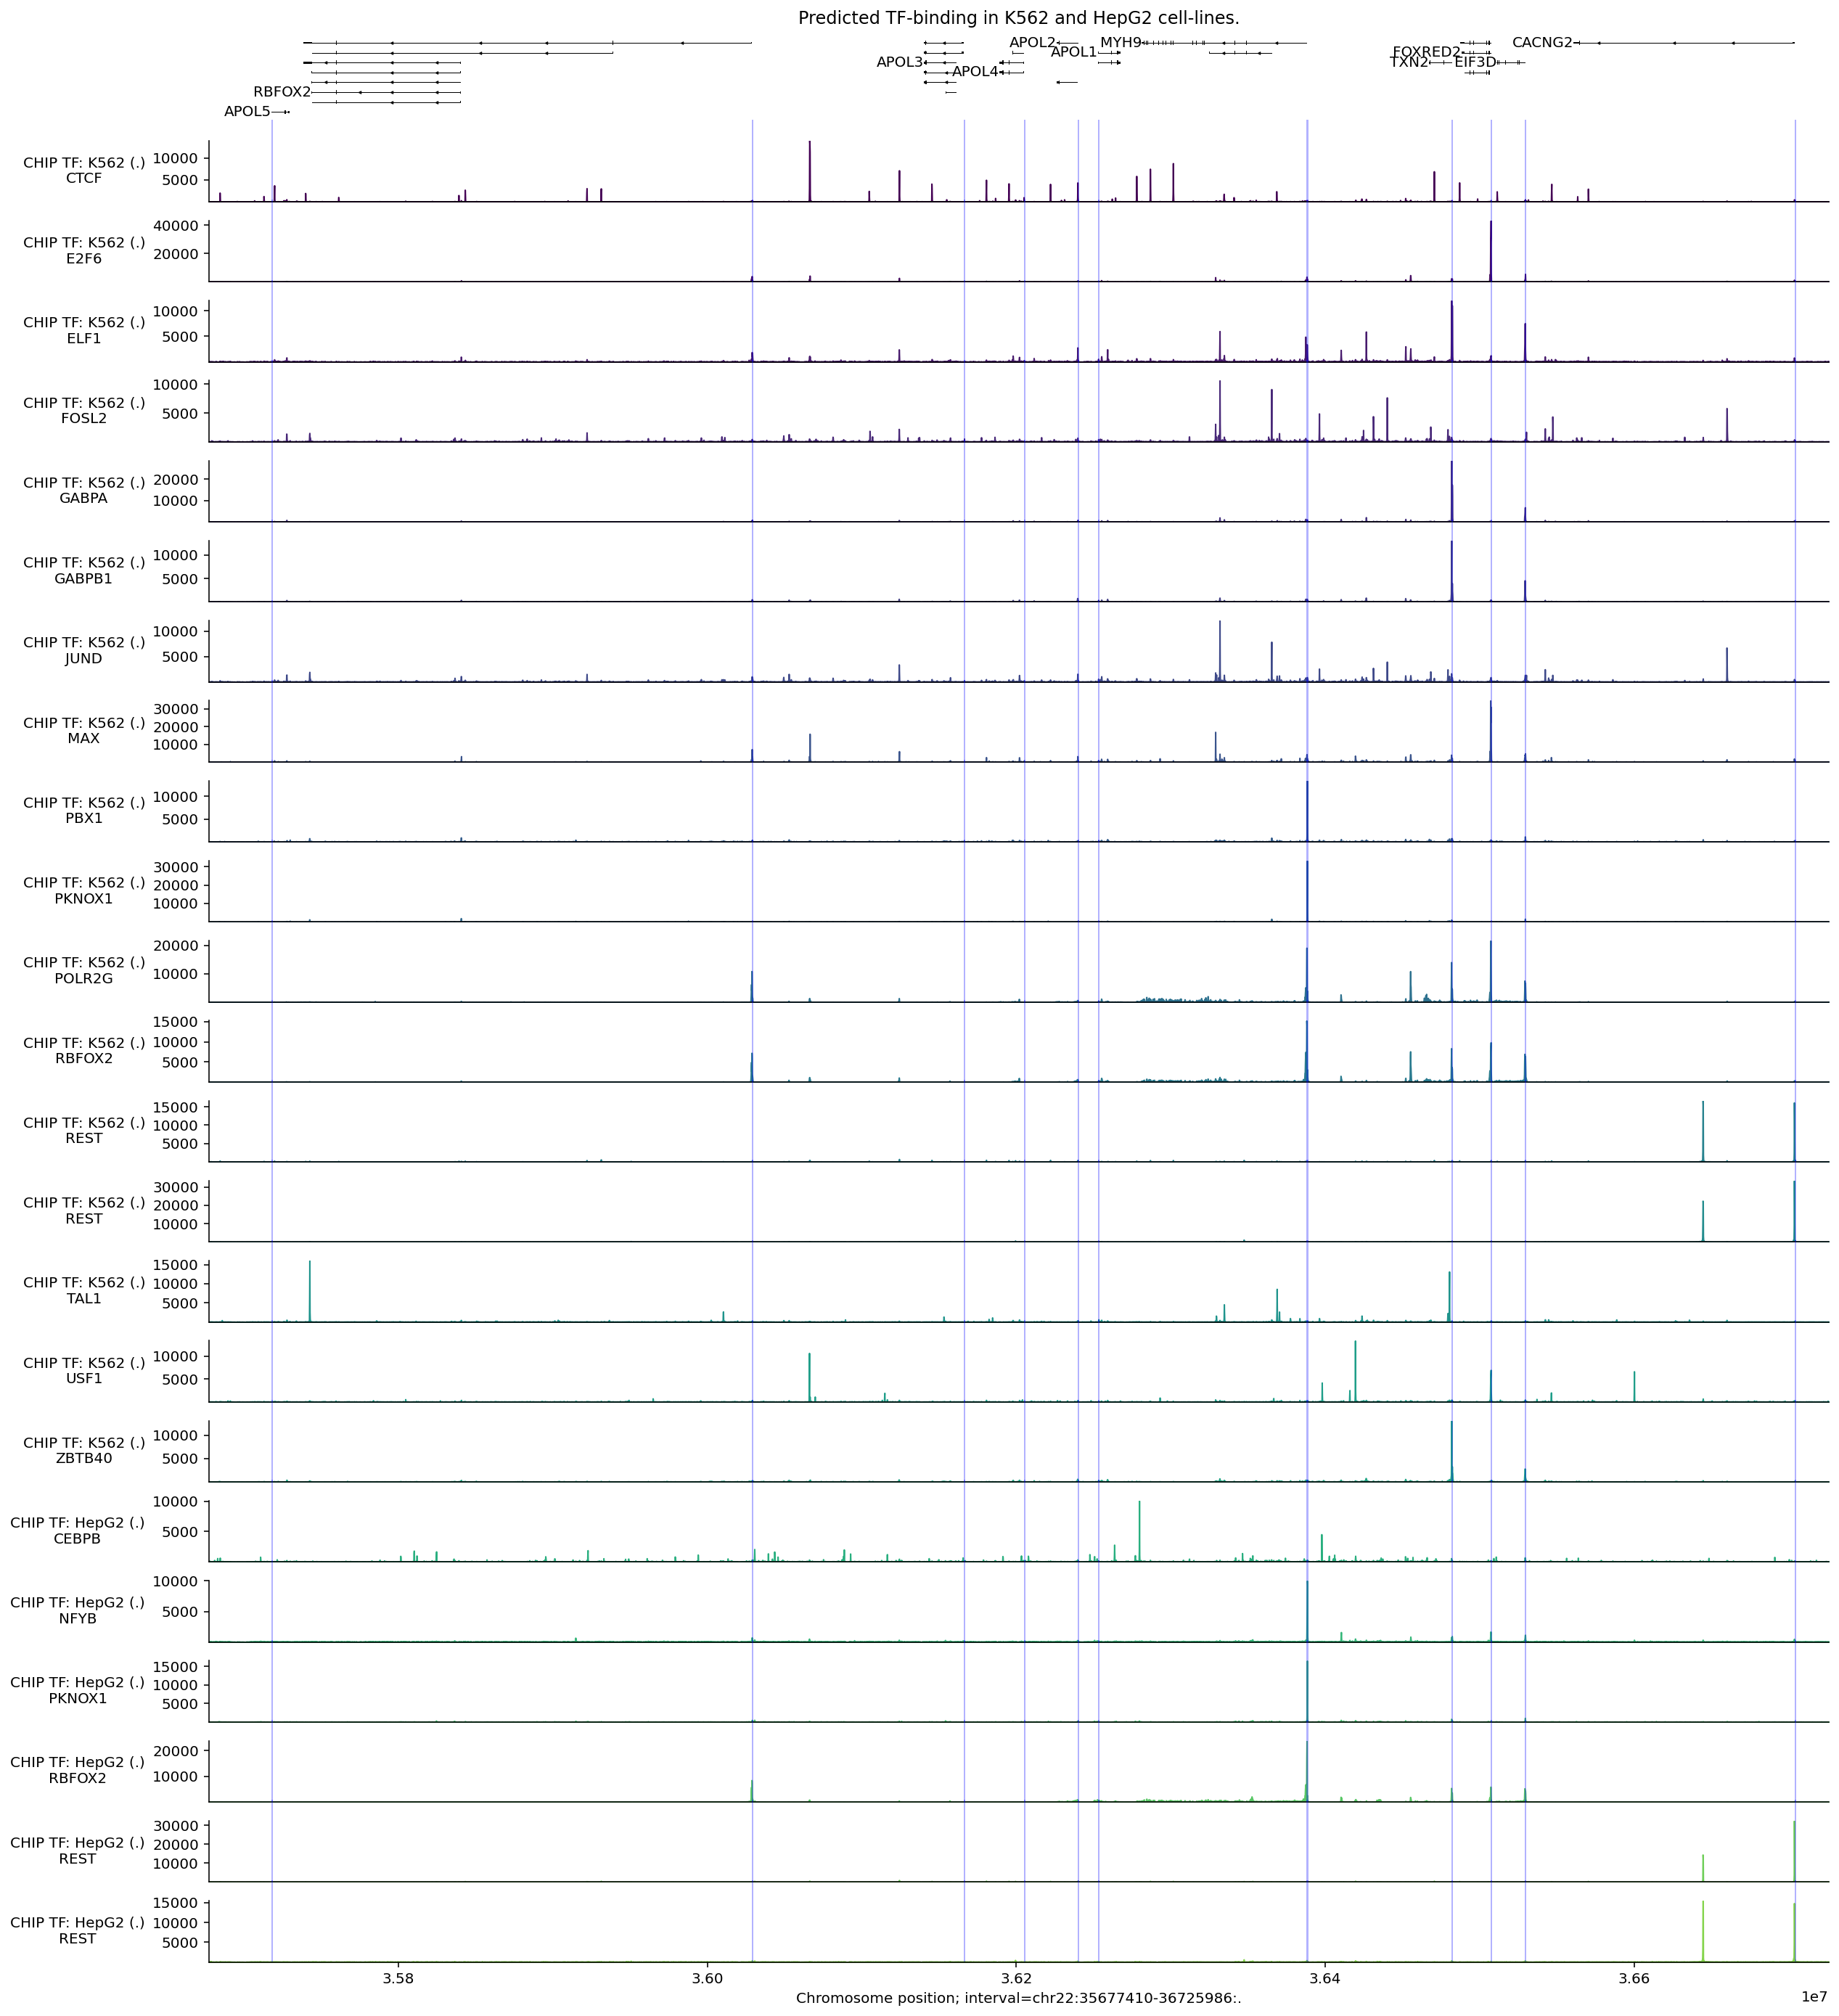
Binding locations for the same protein (e.g., RBFOX2) appear largely the same across these two cell types, with some change in magnitude. Peaks in predicted POLR2G binding, a component of RNA Polymerase II, typically occur near TSS sites.
We can use the same process to select tracks with high peaks anywhere within the APOL4 gene interval:
# Compute max predicted values per track in the APOL4 gene interval.
max_predictions = concatenated_chip_tf.slice_by_interval(
    apol4_interval, match_resolution=True
).values.max(axis=0)

# Filter to the 10 tracks with the highest predictions.
output_filtered = concatenated_chip_tf.filter_tracks(
    (max_predictions >= np.sort(max_predictions)[-10])
)

# Build plot.
plot_components.plot(
    [
        plot_components.TranscriptAnnotation(transcripts),
        plot_components.Tracks(
            tdata=output_filtered,
            ylabel_template=(
                'CHIP TF: {biosample_name} ({strand})\n{transcription_factor}'
            ),
            filled=True,
        ),
    ],
    interval=apol4_interval,
    annotations=[plot_components.IntervalAnnotation(promoter_intervals)],
    despine_keep_bottom=True,
    title='Predicted TF-binding in K562, HepG2, sigmoid and transverse colon.',
)
plt.show()
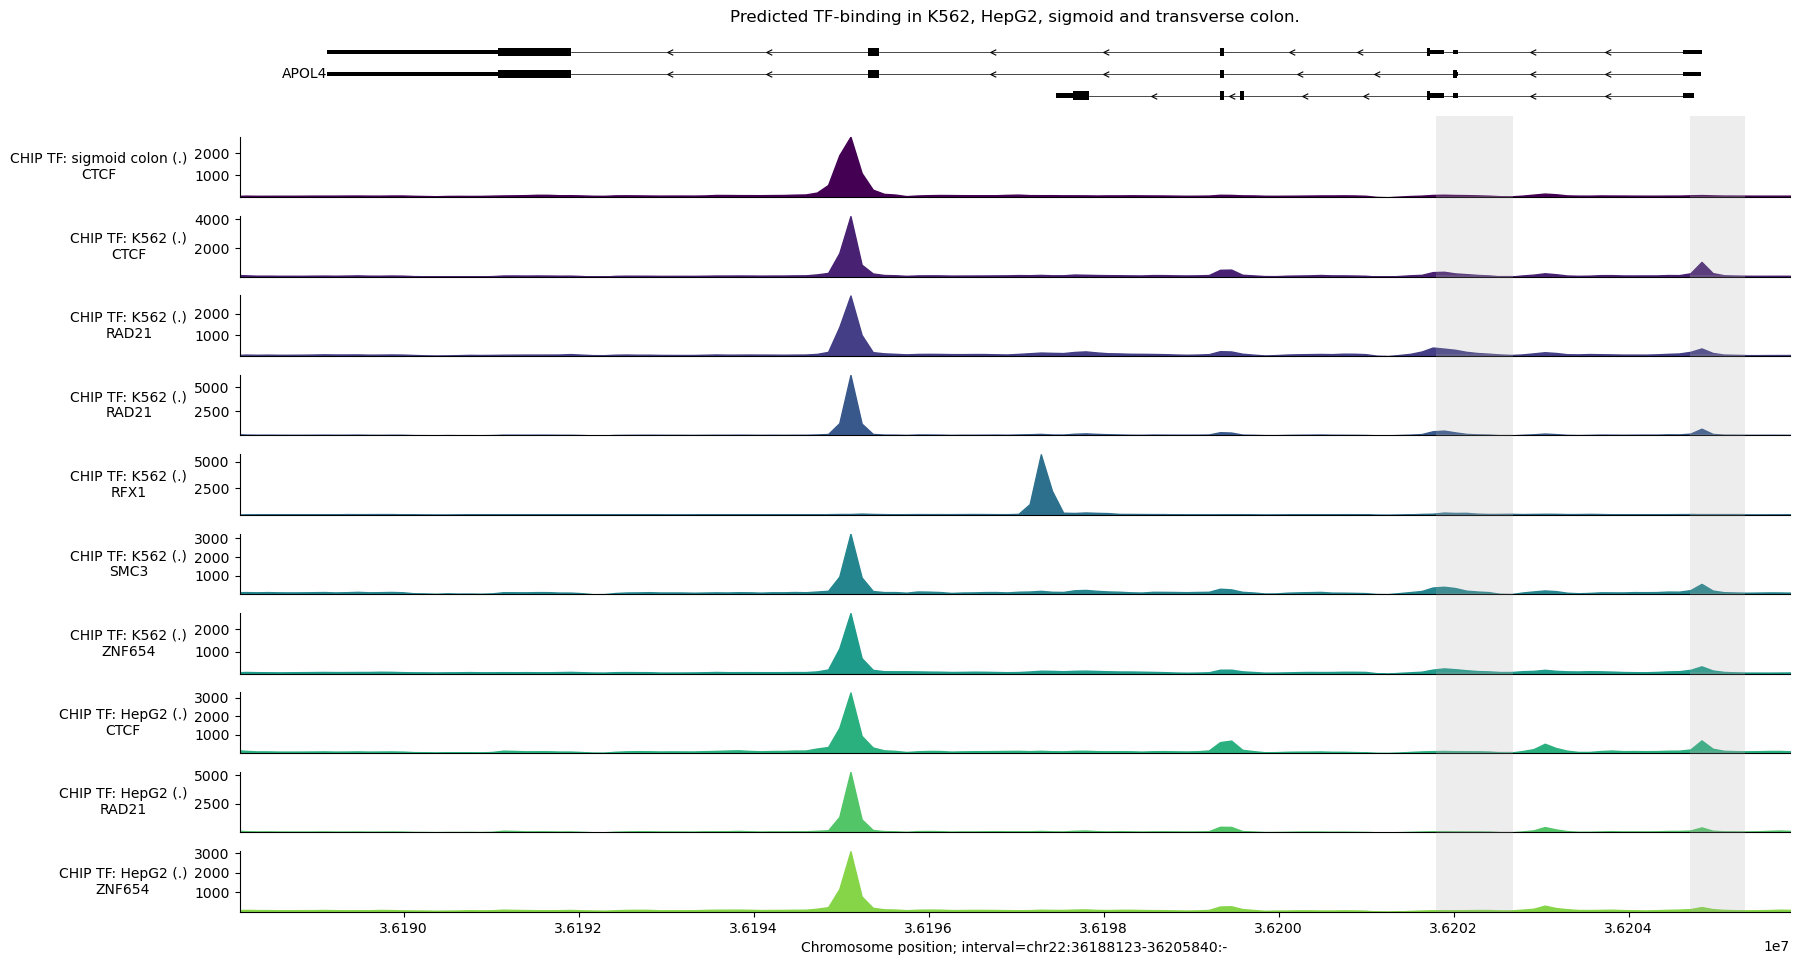
We observe a strong predicted CTCF peak near the second-to-last exon (counting from the right), which is predicted across different tissues.
We can average the signal for a transcription factor across tissues to simplify
the plot. For example, to plot the mean CTCF signal across tissues, we first
need to construct a new TrackData object:
mean_ctcf = output_filtered.values[
    :, output_filtered.metadata['transcription_factor'] == 'CTCF'
].mean(axis=1)

# Construct a new TrackData object from the mean values.
tdata_mean_ctcf = track_data.TrackData(
    values=mean_ctcf[:, None],
    metadata=pd.DataFrame(
        {'transcription_factor': ['CTCF'], 'name': ['mean'], 'strand': ['.']}
    ),
    interval=output_filtered.interval,
    resolution=output_filtered.resolution,
)
And then plot as usual:
plot_components.plot(
    [
        plot_components.TranscriptAnnotation(transcripts),
        plot_components.Tracks(
            tdata=tdata_mean_ctcf,
            ylabel_template='{name} {transcription_factor}',
            filled=True,
        ),
    ],
    interval=apol4_interval,
    annotations=[plot_components.IntervalAnnotation(promoter_intervals)],
    despine_keep_bottom=True,
    title='Predicted CTCF binding (mean across cell types)',
)
plt.show()

Contact maps#
CONTACT_MAPS predicts 3D contact frequency between pairs of 2048 bp bins,
normalized for distance decay (observed over expected, from Hi-C and Micro-C
data). Use intervals substantially wider than 2048 bp.
Let’s make contact map predictions for a colon carcinoma cell line:
condition = 'EFO:0002824'  # HCT116 colon carcinoma cell line.

output = dna_model.predict_interval(
    interval=interval,
    requested_outputs={dna_client.OutputType.CONTACT_MAPS},
    condition=condition,
)
And plot the predicted DNA-DNA contacts:
plot = plot_components.plot(
    [
        plot_components.TranscriptAnnotation(longest_transcripts),
        plot_components.ContactMaps(
            tdata=output.contact_maps,
            ylabel_template='{biosample_name}\n{name}',
            cmap='autumn_r',
            vmax=2.0,
        ),
    ],
    interval=interval,
    title='Predicted contact maps',
)
plt.show()
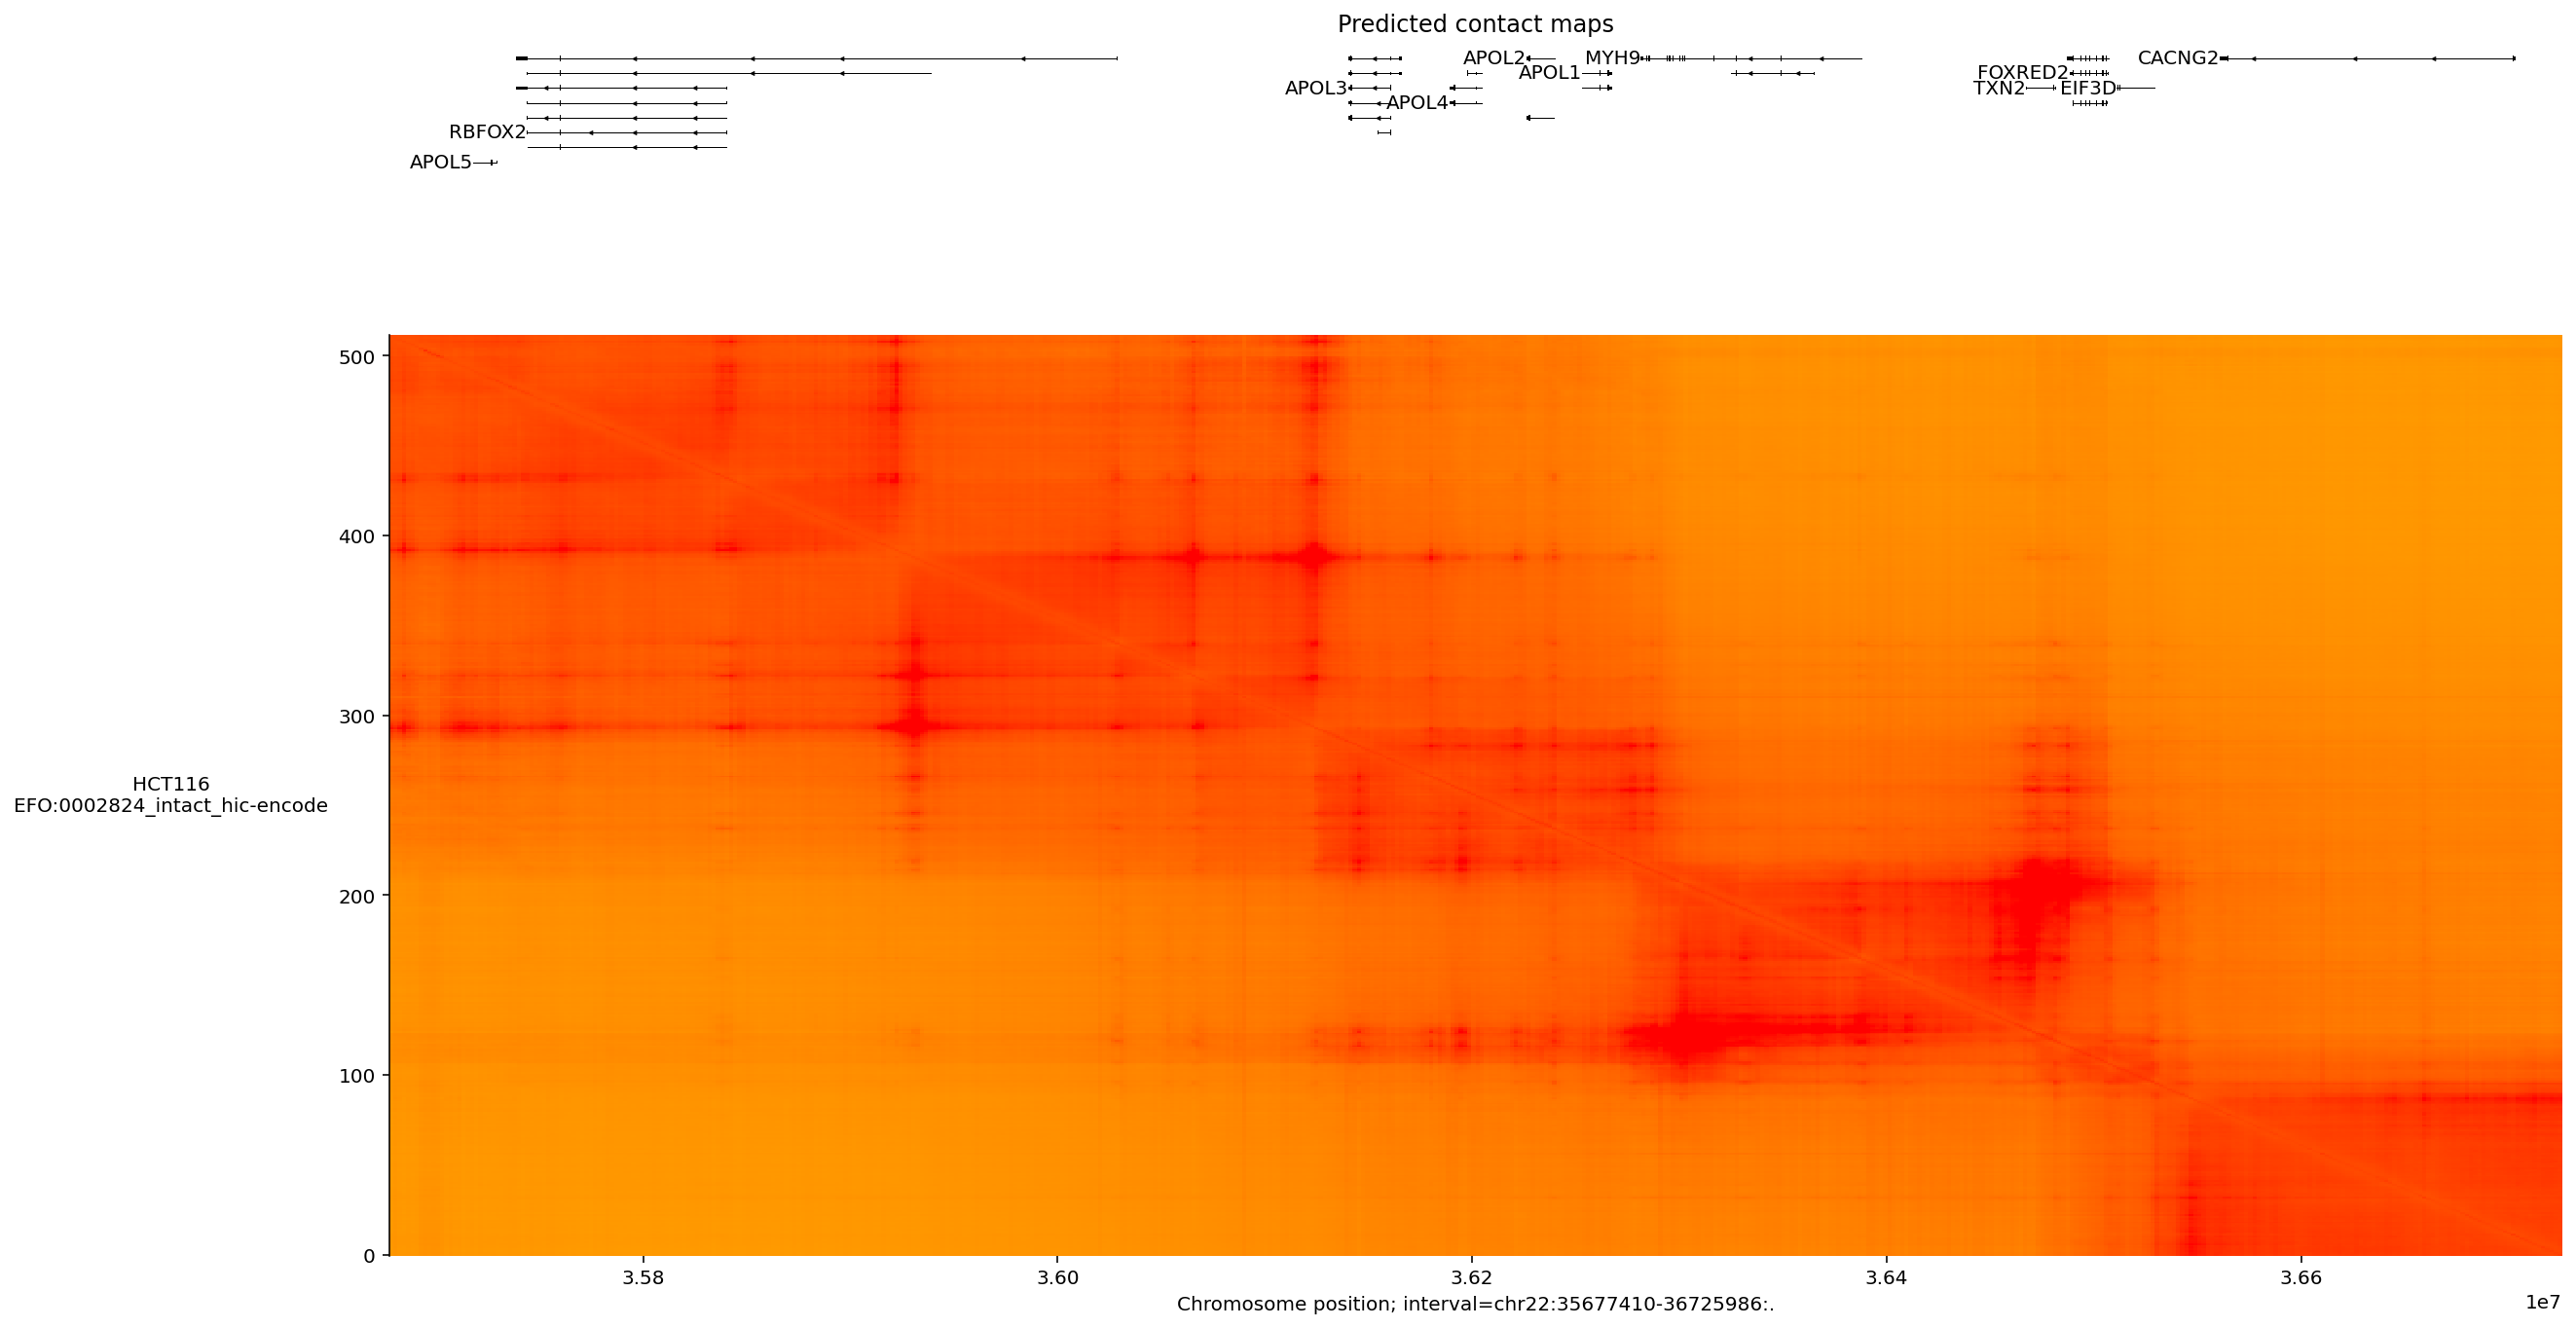
Several prominent interacting regions, potentially representing topologically-associated domains (TADs), are visible as blocks.